Tuesday, August 27, 2013

Showers Bringing Some Relief to Dry Summer

Daily showers are providing much needed moisture across Star Valley.  Amounts have been spotty with the greatest reported today .30 at Star Valley Ranch.  On Monday a quick thundershower dropped .50 at the Cakebread Ranch Weather Station.  With the southerly flow bringing Monsoon moisture northward, chances of afternoon and evening showers will continue for the next several days.  Again some areas will remain dry while others may get a brief heavy shower.

The two active web cameras in the Star Valley Ranch area recorded a very interesting cloud day.  Beginning with morning fog, the August sunshine quickly changes the clouds to convective with passing showers by mid afternoon.  Following are videos of the day from each cam.

Star Valley Ranch cam is located at the Star Valley Ranch Public Works Building and views across the valley at the Caribou Mountains.


The second cam is located near the north end of Star Valley Ranch and views to the north toward Alpine


Friday, August 23, 2013

Pattern Change Leading to a Wet Final Week of August

A major change is taking place in the large scale wind pattern across the United States.  Up until recently high pressure over the west and a trough of low pressure east of the Rockies has persisted much of the summer.  This has brought a very dry summer once again to large areas of the western states including Star Valley. The exception has been over Arizona and New Mexico where the Mexican monsoon has provided beneficial,  mainly mountain rains.


60 day precipitation ending August 23 2013

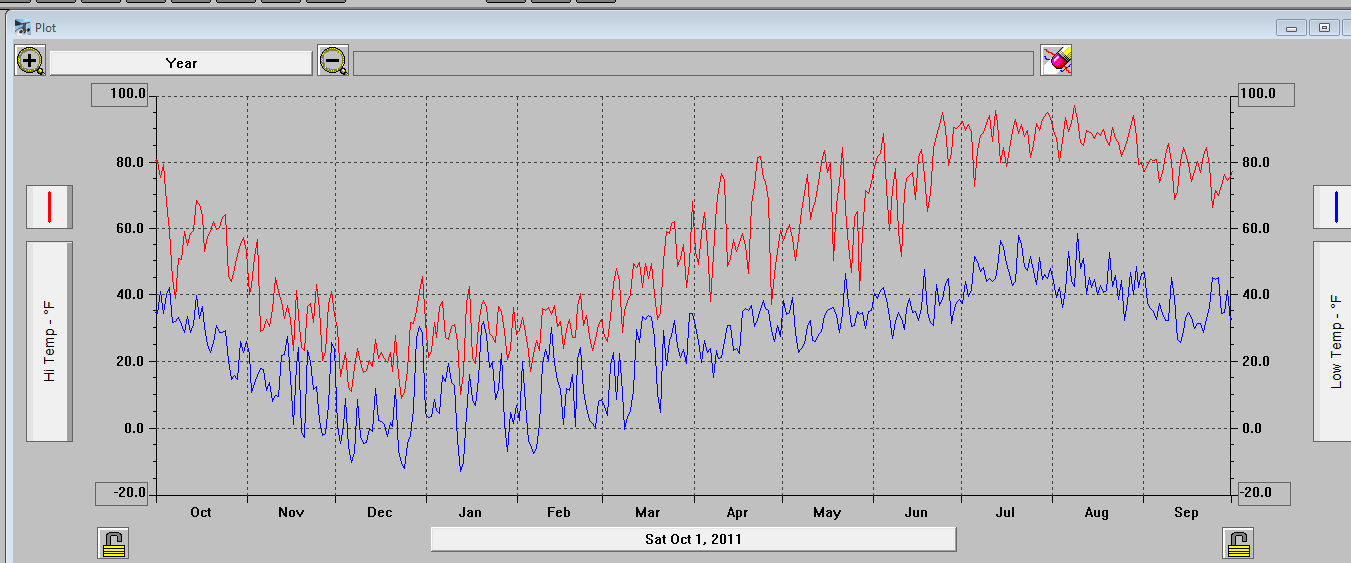
As an example the total precipitation measured at Star Valley Ranch from June 1 until August 23 is just 1.82 inches.

Normally as can been see on the Bedford climatological data, nearly 5 inches are expected in the June, July  and August period.


For the past 90 days ending August 23, 2013 much of western Wyoming was dealing with another dry summer.


Total precipitation for 90 days ending August 23 2013
Much of southern and western Wyoming has had less than 50 percent of the normal amount for this period, some areas much less.

Percent of Normal Precipitation for 90 days ending August 23 2013

As alluded to in the headline of this blog there has been a major shift in the pattern with an upper high over the Plains States and a trough of low pressure off the West Coast. This places much of the interior west under a southerly to southwesterly flow, which has allowed an influx of Monsoon moisture that has primarily been to our south all summer.

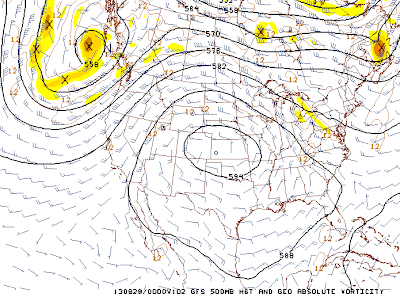
Following is a sequence of 500 mb charts for the next several days which keep the pattern favorable for moisture to continue moving northward across our region.

Friday evening 8/23/13
Saturday evening 8/24/13
Monday evening 8/26/13
Wednesday evening 8/28/13
The purpose in showing the sequence of 500 mb charts for the next 5 days is not only to emphasize the pattern change but also show the upper disturbance that moves northward up the Baja Peninsula.  This feature is the newly formed Tropical Storm Ivo which can be seen on both the visible and water vapor imagery from Friday afternoon.


While still somewhat disorganized the National Hurricane Center is forecasting it to move northward just west of the Baja Peninsula over the weekend.


Although it is not forecasted to reach Hurricane strength prior to weakening over the colder water, the upper air pattern now in place will lead to a large influx of tropical moisture initially into the Desert Southwest over the weekend, and to a lessor extent northward affecting Star Valley, possibly by the first of next week.

Following is the model forecast total precipitation for the coming 6 days.


While for essentially the same period the forecasters at the NWS are indicating a similar forecast as the model.


The amounts of over 2 inches in Western Arizona if verified would equal to a large portion of the annual totals in that area!

While it is still too early to say with high confidence that this very anomalous solution will occur, the potential is certainly worthy of  concern to the south of Star Valley.

We are now in a daily regime of afternoon showers and thunderstorms, which will continue through the weekend.  For Friday there were a few areas that received substantial showers, mostly notably in the Pocatello area.

24 hour precipitation ending at 7 pm Friday 8/23/13

The moisture from Ivo could have an impact on Star Valley as early as Monday.

By the end of next week, potential is good for substantial precipitation to have occurred in many areas of the intermountain region including Star Valley. 

Thursday, August 15, 2013

Lapse Rates and Star Valley Clouds


During the summer months, the predominant cloud type over Star Valley and much of the intermountain west is cumuloform.  Heating of the high elevation surfaces common across this area with any available moisture leads to cumulus and cumulonimbus on most afternoons. On some days  the cumulus remain rather benign while other times they build dramatically into cumulonimbus and thunderstorms. The primary discriminatory parameter as to whether cumulus will develop into thunderstorms, given sufficient moisture, is the lapse rates of the surrounding environment.  Following is a good discussion about lapse rates and the role it plays in atmospheric instability in support of cumulus clouds


Stability of Air

Adiabatic temperature change is an important factor in determining the stability of the air. We can think of air stability as the tendency for air to rise or fall through the atmosphere under its own "power". Stable air has a tendency to resist movement. On the other hand, unstable air will easily rise. What gives air "power" to rise? The tendency for air to rise or fall depends on the adiabatic and environmental lapse rates.

Stable airGraph of stable conditions

Stable Atmospheric Conditions
Stable atmospheric conditions prevail when the environmental lapse rate is less than the saturated adiabatic rate. At the surface (0 meters) both the parcel of air (red line) and the air of the surrounding environment (blue line) have the same temperature. The surrounding air is changing its temperature at a rate of .65oC/100 meters. The parcel on this day is "dry" and will rise and cool at a temperature of 1oC/100 meters. After giving the parcel a slight upward push, it rises to a level of 1000 meters where it cools to a temperature of 20oC. A measurement of the air surrounding the parcel shows a temperature of  23.5oC. In other words, the parcel is colder (and more dense) than the surrounding air at 1000 meters. If the uplift mechanism ceased, the parcel of air would return to the surface.
Graph of unstable conditionsUnstable Atmospheric Conditions

Unstable air

Air is unstable when the environmental lapse rate is greater than the dry adiabatic rate. Under these conditions, a rising parcel of air is warmer and less dense than the air surrounding it at any given elevation.  Follow up the graph for the rising parcel of air. Note that at any elevation above the surface the parcel temperature is higher than the air that surrounds it. Even as it reaches the dew point temperature at 2000 meters, the air remains warmer than the surrounding air. As a result it continues to rise and cool at the saturated adiabatic rate. Vertically developed clouds are likely to develop under unstable conditions such as this.


On August 13 2013, the environmental lapse rates were near dry adiabatic over Star Valley during the day as shown on the nearest upper air evening sounding at Salt Lake City. This was likely typical of the air mass over Star Valley, even though no upper air observation was available.

The sfc-3KM lapse rates is near 10C/km and above 9C/km up to 500mb.

Following is a video taken from the Star Valley Ranch web cam showing the very rapid development of cumulus and then cumulonimbus.


Once the cumulus form, they very quickly grow vertically in the steep lapse rate environment,

Just looking at a two hour period in the early afternoon from both the Star Valley Ranch web cam looking west and the webcam pointed north, clouds grow from inception to full blown cumulonimbus in less than two hours.


Smoke Source over Star Valley

This Thursday morning an extensive area of smoke had spread across much of Star Valley.  The smoke source was with the ongoing fires over the mountains of central Idaho.  By this afternoon smoke had lessened, but the fires continue and westerly winds will likely bring smoke back across the area over at times the next several days.  Following are the visible satellite photos from Thursday morning and again this afternoon.  The smoke source was obvious in the afternoon photo.

Thursday am Visible Imagery


Thursday afternoon visible imagery

Following is the map of active fires as of 5pm Thursday August 15 2013


It is comforting to observed no active fires at this time in the Star Valley Region.


Monday, August 5, 2013

Star Valley Davis Weather Stations

It has been almost 3 years since the first Davis weather stations were established in the Lower portion of the Salt River Valley,  There are currently 7 Davis stations on-line and the potential for a couple more being added by this winter.  Here are the active links to each of these stations as well as their locations and how far back the record for each is available.

Etna Elementary School             October 13 2010

Etna Elementary School

Thayne Elementary School         October 25 2011

Thayne Elementary School

Star Valley  Ranch                     April 17 2011

Star Valley Ranch

Corral Canyon Ln (2 NE Etna)     December 6 2011

Corral Canyon Ln(2 NE Of Etna)

Double L Ranch(2 NW of Etna)     July 30 2012

Double L Ranch(2 NW Etna)     


Cakebread Ranch(3 N of Thayne)  August 16 2013

Cakebread Ranch(3 N of Thayne)

Afton August 2013

Afton


The Etna station has the only continuous record since its establishment in October of 2010.  While Thayne ES was established in October 2010 technical issues precludes the continuous record prior to October of 2011.  The Star Valley Ranch station was moved to its current location on top of the Town of Star Valley Ranch Public Works building on August 10 2011.  Prior to that it had been located in our back yard on the Ranch where wind measurements were greatly reduced due to surrounding trees.

Since Etna ES has the only complete record   the following are the graphs of maximum and minimum temperatures for every day since October 10, 2010 at the Etna station.


In the almost 3 years of record, the highest temperature at the Etna station was 97.1 on August  8 2012.  The coldest was  -25.1 on February 2 2011.  The highest wind gust was 60 MPH on November 16, 2010.

If anyone would like to be able to access the past records for any of these stations, including graphs just contact me at jhales42@gmail.com.

Thursday, August 1, 2013

Weekly Wyoming Weather Video

The Riverton Forecast Office has issued their upcoming weather discussion for much of Wyoming, including into next week

Weekly Wyoming Weather Video

July 2013 Lower Valley Summaries

Following are the Daily Summaries for the 5 active Davis Weather Stations in Lower Star Valley for the month of July 2013

StarValley Ranch


Thayne ES


Etna ES


Double L Ranch(3 NW Etna)


Ausers(2 NE Etna)