Following is the link to the weekly weather video posted by Riverton Forecast Office
Weekly Wyoming Weather Video
Thursday, February 5, 2015


Wednesday, February 4, 2015
Final Snow Report Feb 2-4 2015
| County | Station Name | Snowfall |
|---|---|---|
| Big Horn | 26 E Lovell | 3.5 |
| Big Horn | Bone Springs Divide Snotel | 3 |
| Big Horn | Shell Creek Snotel | 3 |
| Big Horn | Bald Mountain Snotel | 2 |
| Big Horn | Shell | 1.5 |
| Big Horn | 2 SSW Lovell | 1.5 |
| Big Horn | Basin | 1 |
| Big Horn | Lovell | 1 |
| Fremont | 10 W Dubois | 9.5 |
| Fremont | Brooks Lake | 9 |
| Fremont | Little Warm Snotel | 7 |
| Fremont | Castle Creek Snotel | 6 |
| Fremont | Cold Springs Snotel | 6 |
| Fremont | Burroughs Creek Snotel | 5 |
| Fremont | Deer Park Snotel | 5 |
| Fremont | Dubois | 5 |
| Fremont | Hudson | 4.5 |
| Fremont | Riverton | 4-4.2 |
| Fremont | Atlantic City | 4 |
| Fremont | South Pass Snotel | 4 |
| Fremont | Lander Airport | 3.4 |
| Fremont | Lander | 2-3.3 |
| Fremont | 6 SW Lander | 3.1 |
| Fremont | Hobbs Park Snotel | 3 |
| Fremont | Riverton Airport | 3 |
| Fremont | Burris | 3 |
| Fremont | 7 WNW Lander | 2.3 |
| Fremont | 7 ESE Kinnear | 2 |
| Fremont | Townsend Creek Snotel | 2 |
| Fremont | St. Lawrence Alt Snotel | 2 |
| Fremont | 10 NW Riverton | 2 |
| Fremont | 9 S Lander | 2 |
| Fremont | 9 SSE Lander | 1.5 |
| Fremont | 6 SE Lander | 1.5 |
| Fremont | 15 W Jeffrey City | 1 |
| Fremont | Boysen Dam | 1 |
| Hot Springs | Thermopolis | 3.2 |
| Hot Springs | Owl Creek Snotel | 3 |
| Hot Springs | 9 NE Thermopolis | 2.6 |
| Hot Springs | Kirby | 2.5 |
| Johnson | Bear Trap Meadow Snotel | 5 |
| Johnson | Hansen Sawmill Snotel | 4 |
| Johnson | 1 NW Buffalo | 4 |
| Johnson | Little Goose Snotel | 3 |
| Johnson | Soldier Park Snotel | 2 |
| Johnson | Kaycee | 2 |
| Johnson | Cloud Peak Reservoir Snotel | 2 |
| Johnson | 17 E Kaycee | 1.8 |
| Johnson | Buffalo | 1.2 |
| Lincoln | Willow Creek Snotel | 16 |
| Lincoln | Spring Creek Divide Snotel | 14 |
| Lincoln | Cottonwood Creek Snotel | 13 |
| Lincoln | Blind Bull Summit | 12 |
| Lincoln | Indian Creek Snotel | 11 |
| Lincoln | Blind Bull Summit Snotel | 10 |
| Lincoln | Salt River Summit Snotel | 8 |
| Lincoln | Commissary Ridge | 8 |
| Lincoln | Hams Fork Snotel | 7 |
| Lincoln | Kelley Ranger Station Snotel | 7 |
| Lincoln | Box Y Ranch | 2 |
| Lincoln | 2 SE Thayne | 0.7 |
| Lincoln | Afton | 0.5 |
| Natrona | Reno Hill Snotel | 6 |
| Natrona | Grave Spring Snotel | 6 |
| Natrona | Powder River | 5 |
| Natrona | Casper | 4 |
| Natrona | 5 SSW Casper | 3.5 |
| Natrona | Midwest | 3-3.5 |
| Natrona | 10 WSW Casper | 3 |
| Natrona | Casper Airport | 2.9 |
| Natrona | Casper Mountain Snotel | 1 |
| Park | Blackwater Snotel | 6 |
| Park | 3 NE Sunshine | 5.1 |
| Park | Timber Creek Snotel | 5 |
| Park | Meeteetse | 4-4.5 |
| Park | 8 WSW Meeteetse | 4 |
| Park | Kirwin Snotel | 4 |
| Park | Wolverine Snotel | 3 |
| Park | Evening Star Snotel | 3 |
| Park | 26 SW Cody | 2.5 |
| Park | Marquette Snotel | 2 |
| Park | Pahaska | 2 |
| Park | 3 W Wapiti | 1.6 |
| Park | 2 WSW Cody | 1.5 |
| Park | 1 W Cody | 1.5 |
| Park | 5 ESE Cody | 1.5 |
| Park | Cody | 1.3 |
| Park | 3 NE Clark | 0.5 |
| Sublette | Triple Peak Snotel | 17 |
| Sublette | Gunsite Pass Snotel | 10 |
| Sublette | Loomis Park Snotel | 10 |
| Sublette | Snider Basin Snotel | 9 |
| Sublette | Big Sandy Opening Snotel | 8 |
| Sublette | Pocket Creek Snotel | 8 |
| Sublette | Kendall Ranger Station Snotel | 7 |
| Sublette | Larsen Creek Snotel | 7 |
| Sublette | 15 WNW Daniel | 7 |
| Sublette | New Fork Lake Snotel | 6 |
| Sublette | Daniel | 6 |
| Sublette | Elkhart Park G.S. Snotel | 6 |
| Sublette | Daniel Fish Hatchery | 5.2 |
| Sublette | East Rim Divide Snotel | 5 |
| Sublette | 14 NW Pinedale | 4 |
| Sublette | 1 N Pinedale | 3.5 |
| Sublette | Pinedale | 3.2 |
| Sublette | Boulder Rearing Station | 1 |
| Sublette | Big Piney | 1 |
| Teton | Phillips Bench Snotel | 20 |
| Teton | Grand Targhee Snotel | 18 |
| Teton | Togwotee Pass Snotel | 14 |
| Teton | Jackson Hole - Mid Mountain | 13 |
| Teton | Jackson Hole - Rendezvous Bowl | 13 |
| Teton | Jackson Hole - Raymer | 13 |
| Teton | Gros Ventre Summit Snotel | 11 |
| Teton | Granite Creek Snotel | 11 |
| Teton | Grassy Lake Snotel | 10 |
| Teton | Base Camp Snotel | 9 |
| Teton | Grand Targhee - Chief Joseph | 9 |
| Teton | Togwotee Mountain Lodge | 8 |
| Teton | Snake River Stn Snotel | 5 |
| Teton | Jackson Hole - Base | 4 |
| Teton | 1 ENE Teton Village | 3.5 |
| Teton | Moose | 3 |
| Teton | 12 NE Jackson | 2.5 |
| Teton | Snow King | 2 |
| Teton | 12 NE Jackson | 2 |
| Teton | Jackson | 1 |
| Washakie | Powder River Pass Snotel | 6 |
| Washakie | 16 SSE Ten Sleep | 3.5 |
| Washakie | Middle Powder Snotel | 3 |
| Washakie | Ten Sleep | 2.3 |
| Washakie | 5 NNW Ten Sleep | 1.1 |
| Washakie | 8 SW Worland | 1 |
| Yellowstone | Two Ocean Plateau Snotel | 8 |
| Yellowstone | Lewis Lake Divide Snotel | 6 |
| Yellowstone | Parker Peak Snotel | 4 |
| Yellowstone | East Entrance Ranger Station | 3.5 |
| Yellowstone | Sylvan Road Snotel | 3 |
| Yellowstone | Canyon Snotel | 3 |
| Yellowstone | Sylvan Lake Snotel | 2 |
| Yellowstone | Old Faithful Ranger Station | 1.5 |
| Yellowstone | Thumb Divide Snotel | 1 |
| Yellowstone | Tower Falls Ranger Station | 1 |
| Yellowstone | Lamar Ranger Station | 0.5 |
Tuesday, February 3, 2015
Storm Snow Totals as of 5 PM Tuesday
UBLIC INFORMATION STATEMENT NATIONAL WEATHER SERVICE RIVERTON WY 513 PM MST TUE FEB 3 2015 THE SECOND ROUND OF SNOW OCCURRED MONDAY NIGHT INTO TUESDAY MORNING OVER WESTERN AND CENTRAL WYOMING. HERE ARE SOME OF THOSE SNOWFALL AMOUNTS. LOCATION SNOWFALLLINCOLN COUNTY... WILLOW CREEK SNOTEL... 12 INCHES. BLIND BULL SUMMIT... 7 INCHES. COTTONWOOD CREEK SNOTEL... 7 INCHES. BLIND BULL SUMMIT SNOTEL... 7 INCHES. COMMISSARY RIDGE... 5 INCHES. SPRING CREEK DIVIDE SNOTEL... 4 INCHES. BOX Y RANCH... 4 INCHES. SALT RIVER SUMMIT SNOTEL... 3 INCHES. KELLEY RANGER STATION SNOTEL... 3 INCHES.STAR VALLEY RANCH 2 INCHES 5 SSE SMOOT... 1 INCH.HAMS FORK SNOTEL... 1 INCH. INDIAN CREEK SNOTEL... 1 INCH. 3 SE BEDFORD... 0.5 INCHES. 2 SE THAYNE... 0.2 INCHES.BIG HORN COUNTY... BONE SPRINGS DIVIDE SNOTEL... 4 INCHES. BALD MOUNTAIN SNOTEL... 3 INCHES. FREMONT COUNTY... BROOKS LAKE... 4 INCHES. BURROUGHS CREEK SNOTEL... 3 INCHES. HOT SPRINGS COUNTY... OWL CREEK SNOTEL... 1 INCH. JOHNSON COUNTY... LITTLE GOOSE SNOTEL... 1 INCH. CLOUD PEAK RESERVOIR SNOTEL... 1 INCH. SOLDIER PARK SNOTEL... 1 INCH. HANSEN SAWMILL SNOTEL... 1 INCH. NATRONA COUNTY... GRAVE SPRING SNOTEL... 1 INCH. PARK COUNTY... BLACKWATER SNOTEL... 7 INCHES. BEARTOOTH LAKE SNOTEL... 4 INCHES. KIRWIN SNOTEL... 1 INCH. WOLVERINE SNOTEL... 1 INCH. PAHASKA... 1 INCH. EVENING STAR SNOTEL... 1 INCH. MARQUETTE SNOTEL... 1 INCH. SUBLETTE COUNTY... GUNSITE PASS SNOTEL... 5 INCHES. SNIDER BASIN SNOTEL... 5 INCHES. TRIPLE PEAK SNOTEL... 5 INCHES. ELKHART PARK G.S. SNOTEL... 4 INCHES. NEW FORK LAKE SNOTEL... 3 INCHES. LOOMIS PARK SNOTEL... 3 INCHES. 14 NW PINEDALE... 1.4 INCHES. EAST RIM DIVIDE SNOTEL... 1 INCH. KENDALL RANGER STATION SNOTEL... 1 INCH. BIG SANDY OPENING SNOTEL... 1 INCH. PINEDALE... 0.2 INCHES. DANIEL FISH HATCHERY... 0.2 INCHES. TETON COUNTY... PHILLIPS BENCH SNOTEL... 9 INCHES. JACKSON HOLE - RAYMER... 7.5 INCHES. GRASSY LAKE SNOTEL... 7 INCHES. GRAND TARGHEE SNOTEL... 5 INCHES. JACKSON HOLE - MID MOUNTAIN... 5 INCHES. JACKSON HOLE - RENDEZVOUS BOWL... 5 INCHES. GRAND TARGHEE - CHIEF JOSEPH... 3 INCHES. TOGWOTEE MOUNTAIN LODGE... 3 INCHES. TOGWOTEE PASS SNOTEL... 3 INCHES. MOOSE 0.4 SOUTH... 3 INCHES. GRANITE CREEK SNOTEL... 3 INCHES. JACKSON HOLE - BASE... 2 INCHES. SNOW KING... 2 INCHES. MOOSE... 1.6 INCHES. 12 NE JACKSON... 1 INCH. SNAKE RIVER STN SNOTEL... 1 INCH. 2 NE TETON VILLAGE... 1 INCH. BASE CAMP SNOTEL... 1 INCH. GROS VENTRE SUMMIT SNOTEL... 1 INCH. YELLOWSTONE NATIONAL PARK... LEWIS LAKE DIVIDE SNOTEL... 7 INCHES. TWO OCEAN PLATEAU SNOTEL... 7 INCHES. PARKER PEAK SNOTEL... 6 INCHES. YELLOWSTONE EAST ENTRANCE... 1.5 INCHES. SYLVAN LAKE SNOTEL... 1 INCH. THUMB DIVIDE SNOTEL... 1 INCH. CANYON SNOTEL... 1 INCH.
Sunday, February 1, 2015
Snow and Possibly Rain Return to Star Valley
After a basically snowless two weeks the later half of January, Star Valley is seeing to a return of more typical mid-winter conditions. Snow is being reported from much of Northwest Wyoming including Star Valley this Sunday evening. A flow of moist Pacific air has spread across the Pacific Northwest into northwest Wyoming, and will continue for the next 3 days. The real question is where will the snow level be at during the event as the air mass is relatively warm for February.
There is considerable confidence that substantial precipitation will occur from Star Valley northward to Yellowstone Park with a couple feet of snow in the higher mountains. The latest computer model forecast precipitation for the next 3 days clearly focuses the precipitation in this area.
The 500mb wind pattern shows the flow from off the Pacific with the cold air remaining well to the north and east of Western Wyoming.
A forecast of the vertical profile of temperature and moisture over Star Valley for Tuesday evening show the deep moisture and strong westerly flow, along with the freezing level about 7500 feet.
This moist and relatively warm profile support snow either mixing with rain at times or possibly turning to rain over the next 3 days. Nevertheless there is potential for significant amount of wet snow, particularly higher elevations of the Valley, near or above 6500 feet.
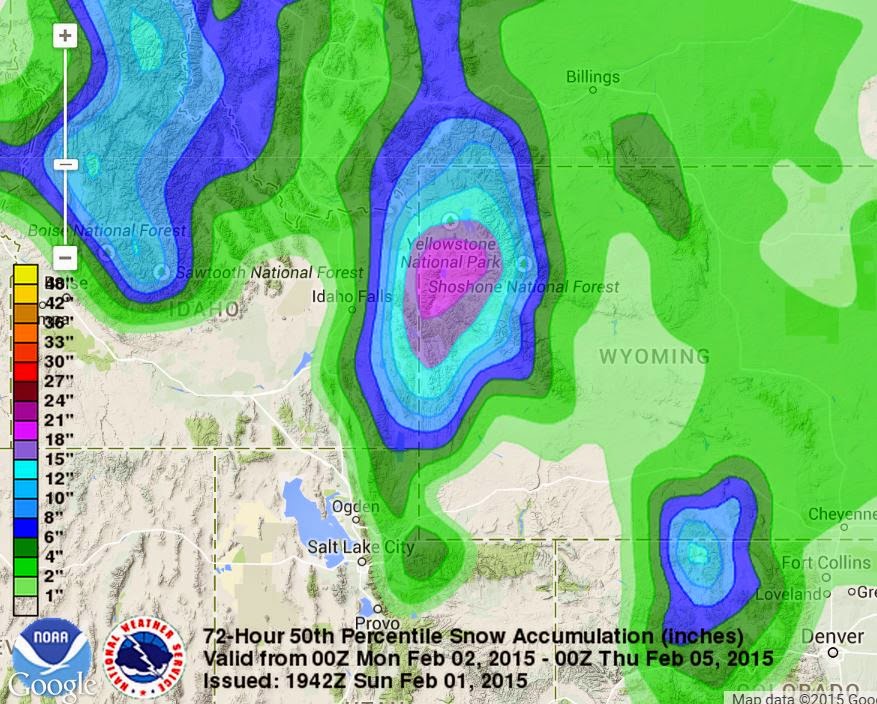
The NWS forecasters at the Weather Prediction Center provide a 72 hour accumulation of snow ending Wednesday evening. They are predicting a 50 percent chance of well over a foot in the higher elevations from Star Valley to Yellowstone NP. Near 2 feet is being forecast for locations such as the Tetons and possibly the northern Wyoming and Salt Ranges as well.
There is considerable confidence that substantial precipitation will occur from Star Valley northward to Yellowstone Park with a couple feet of snow in the higher mountains. The latest computer model forecast precipitation for the next 3 days clearly focuses the precipitation in this area.
 |
| 72 Hour total precipitation ending Wednesday evening Feb 4 2015 |
 |
| 500mb analysis Sunday evening Feb 1 2015 |
 |
| model sounding over Star Valley Tue pm Feb 3 2015 |
The NWS forecasters at the Weather Prediction Center provide a 72 hour accumulation of snow ending Wednesday evening. They are predicting a 50 percent chance of well over a foot in the higher elevations from Star Valley to Yellowstone NP. Near 2 feet is being forecast for locations such as the Tetons and possibly the northern Wyoming and Salt Ranges as well.
 |
Friday, January 30, 2015
Thursday, January 29, 2015
Initial Wyoming Spring Flood Potential Outlook
Initial January 2015 Wyoming Spring Flood Potential Outlook----issued January 26, 2015
Quick Synopsis:
Mountain snowpack and associated snow water equivalents (SWEs) across Wyoming were generally near average by late January. SWEs at the peak snowmelt runoff elevations (8,000’ – 9.500’) were the highest across northwestern Wyoming at 110 to 120 percent of median; while across southern Wyoming, SWEs were 70 to 80 percent of median at the peak snowmelt runoff elevations.
This outlook is based on various diverse hydrological factors such as snow water equivalents (SWEs) in the mountain snowpack, basin morphology (i.e. how basins respond to snowmelt), amount of bark beetle kill, low elevation snow depths, and likely temperature and precipitation trends during late spring/early summer.
HIGHLIGHTS:
…Low to Moderate potential for flooding associated with snowmelt is expected across various headwater streams along eastern portions of the Big Horn Basin. Streams with the highest potential for flooding include Medicine Lodge Creek, Ten Sleep Creek (Ten Sleep), and portions of the Nowood River…
…Low to Moderate potential for flooding associated with snowmelt (due to current snow depths) is expected along portions of Hot Springs County…
…All other of headwater basins across Wyoming can expect a generallyLow potential for flooding due to springtime snowmelt...
The next graphical outlook will be issued around the 25th of February.
*****************************************************************************************
*****************************************************************
The current Wyoming Spring 2015 Snowmelt Runoff Flood Potential Outlook graphic:

Saturday, January 24, 2015
California Drought Going From Bad to Worse
Drought conditions across California are just getting worse as exceptionally warm and dry weather is expected through the remainder of January 2015. Following is a blog posted by Dr. Jeff Masters of Weather Underground summarizing the conditions.
California Drought Worsening During Height of Rainy Season
By: Dr. Jeff Masters , 9:10 PM GMT on January 23, 2015
The Western U.S. winter rainy season has reached its halfway point, and there is only bad news to report for drought-beleaguered California. November through March marks the period when California receives its heaviest rains and snows, thanks to the wintertime path of the jet stream, which dips to the south and brings wet Pacific low pressure systems to the state. The rainy season started out promisingly, with several December storms bringing precipitation amounts close to average for the month over much of the state. Troublingly, though, record-warm ocean temperatures off of the coast meant that the December storms were unusually warm. This resulted in snow falling only at very high elevations, keeping the critical Sierra snow pack much lower than usual. The jet stream pattern shifted during January 2015, bringing disastrously dry conditions to the state. January usually brings 4.19" of rain to San Francisco, but no rain at all has fallen in January 2015 in the city--or over much of Central California. The dryness has been accompanied by near-record warmth at higher elevations in the Sierras, with temperatures at Blue Canyon and South Lake Tahoe averaging nearly 8°F above average for the month of January. As a result, the snowpack in the Sierras--a critical reservoir of water that is used throughout the rest of the year--is abysmally low, running about 30% of normal for this time of year. California's eight largest reservoirs are 33% - 86% below their historical average, and the portion of the state covered by the highest level of drought expanded in mid-January--a very ominous occurrence for the height of the rainy season.

Figure 1. The Enterprise Bridge passes over a section of Lake Oroville that was nearly dry on September 30, 2014, in Oroville, California. Lake Oroville, California's 2nd largest reservoir, was at 49% of average(30% of capacity), the second lowest level on record (behind 1977.) Heavy rains in December 2014 allowed lake levels to recover slightly--as of January 23, 2015 Lake Oroville was at its 7th lowest level of the past 35 years. Image credit: California Department of Water Resources.

Figure 2. The same view of Lake Oroville in happier times: July 20, 2011. (Paul Hames/California Department of Water Resources/Getty Images)
The forecast: hot and dry
An intense ridge of high pressure will build in over California this weekend, bringing near-record high temperatures in the low to mid-70s to San Francisco. The all-time hottest January temperature in San Francisco of 73°F, set just last year, could fall on Sunday. The ridge of high pressure will stay entrenched over California during the remainder of January, bringing continued dry conditions. A weak upper-level low pressure system will bring a few rain showers to the state beginning this Tuesday, but rainfall amounts will be generally less than 1/2"--an insignificant drop in a very large, dry bucket. With long-range models showing no shift in the jet stream pattern through the first week of February, California may be on its way to a fourth consecutive bone-dry rainy season--pushing the state into an increasingly dire drought situation.

Figure 3. Time series of the change in drought conditions in California from January 28, 2014 through January 22, 2015. The area covered by the worst category of drought--"Exceptional"--peaked at 58% during the summer of 2014. In December 2014, "Exceptional" drought coverage fell to 32%, thanks to heavy rains, but this area increased again to 39% in mid-January 2015 due to unusual dryness. Image credit: drought.gov.
Related blog post: The State of the California Drought: Still Very Bad, January 13, 2015, by water resources expert Dr. Peter Gleick of the Pacific Institute.

Figure 1. The Enterprise Bridge passes over a section of Lake Oroville that was nearly dry on September 30, 2014, in Oroville, California. Lake Oroville, California's 2nd largest reservoir, was at 49% of average(30% of capacity), the second lowest level on record (behind 1977.) Heavy rains in December 2014 allowed lake levels to recover slightly--as of January 23, 2015 Lake Oroville was at its 7th lowest level of the past 35 years. Image credit: California Department of Water Resources.

Figure 2. The same view of Lake Oroville in happier times: July 20, 2011. (Paul Hames/California Department of Water Resources/Getty Images)
The forecast: hot and dry
An intense ridge of high pressure will build in over California this weekend, bringing near-record high temperatures in the low to mid-70s to San Francisco. The all-time hottest January temperature in San Francisco of 73°F, set just last year, could fall on Sunday. The ridge of high pressure will stay entrenched over California during the remainder of January, bringing continued dry conditions. A weak upper-level low pressure system will bring a few rain showers to the state beginning this Tuesday, but rainfall amounts will be generally less than 1/2"--an insignificant drop in a very large, dry bucket. With long-range models showing no shift in the jet stream pattern through the first week of February, California may be on its way to a fourth consecutive bone-dry rainy season--pushing the state into an increasingly dire drought situation.
Figure 3. Time series of the change in drought conditions in California from January 28, 2014 through January 22, 2015. The area covered by the worst category of drought--"Exceptional"--peaked at 58% during the summer of 2014. In December 2014, "Exceptional" drought coverage fell to 32%, thanks to heavy rains, but this area increased again to 39% in mid-January 2015 due to unusual dryness. Image credit: drought.gov.
Related blog post: The State of the California Drought: Still Very Bad, January 13, 2015, by water resources expert Dr. Peter Gleick of the Pacific Institute.
Subscribe to:
Posts (Atom)