Riverton Forecast Office has issued their weekly weather Video covering this coming weekend.
Weekend Weather Video Briefing
Thursday, December 11, 2014


Monday, December 8, 2014
Cloud Seeding for Increased Snowfall in Star Valley
The Winter of 2014-2015 will be the 3rd in which active cloud seeding has been conducted in Star Valley with the goal of enhancing the snow pack over the Salt and Wyoming Ranges. The seeding is being done by Idaho Power out of Boise ID who provides electricity across Southern Idaho and Eastern Oregon.
I was given an opportunity to submit questions about cloud seeding by Idaho Power as it relates to Star Valley. Derek Blestrud, one of the three Idaho Power meteorologist, responded with very informative answers.
Following are those questions and answers.
1. How long has Idaho Power been conducting cloud seeding?
Idaho Power first started looking into cloud seeding in the early 90’s in response to a question from a shareholder. After an extensive literature and climatology study, Idaho Power first contracted a cloud seeding program in the 96-97 winter seasons in the Payette River Basin north of Boise. The project was soon suspended due to excessive snowpack. In 2003, Idaho Power began operating its own cloud seeding project in the Payette River Basin. In 2008 Idaho Power began working with the High Country RC&D and expanded operations into the Upper Snake Region. In 2006 the State of Wyoming released the results of a Level II feasibility study evaluating cloud seeding potential in the Salt and Wyoming ranges. In 2010, Idaho Power working with the Western Wyoming RC&D to build upon Wyoming's feasibility study and began collecting weather data to further evaluate the feasibility of cloud seeding in the Salt and Wyoming Ranges of western Wyoming and began seeding in 2012. In 2013 Idaho Power conducted aircraft operations over the Wood River Basin of central Idaho. This year further expansion is being conducted into the Wood River Basin as well as the Boise River Basin.

2. How much increase in snowfall has been credited to the cloud seeding?
Determining the benefits of cloud seeding have a lot of variables. The main variable is targeting or lack thereof. This can be a function of cloud seeding generator spacing and elevation as well as aircraft operations and storm conditions. Never the less, literature shows that a well run wintertime orographic cloud seeding program can increase precipitation by 5 to 15%. Using a target/control analysis over the Payette target area since seeding began in 2003 has shown over a 14% increase during that time frame. Idaho Power is also working with the National Center for Atmospheric Research (NCAR) to develop a real-time cloud seeding model that simulates cloud seeding within a high resolution WRF model (1.8km). Currently this model is in the development state, but has shown values similar to what the target/control analysis is showing.
3. What are the ideal conditions to determine when to begin seeding?
Cloud seeding works best when there is an abundance of supercooled liquid water(SLW) within a storm system and a lack of ice nuclei as well as a wind direction that will provide enough orographic lift to transport the seeding agent into the storm system and areas of SLW. The most common time that this occurs is when there is a warmer wintertime storm system that is very shallow, does not have the upper cold portion of the cloud to feed ice crystals into the SLW layer. Silver iodide works best for cloud seeding between the temperatures of -5 to -15°C(23 to 5F) with the sweet spot between -8 and -10°C(18 to 14F). At warmer temperatures, freezing of the SLW is just too slow to produce precipitation increases with silver iodide. At cooler temperatures, the clouds become adequate in supplying the SLW layer with ice crystals to naturally seed the cloud.
4. How much affect does seeding have on the amount of snowfall in the populated areas of Star Valley vs the adjacent mountains?
This is somewhat of an unknown but we are working with NCAR to model increases from snowfall in a spatial form. The current thinking is that there are potentially some increase in Star Valley, but they are limited. The reason behind this is that we are growing snowflakes using the updraft produced from the mountains. This would occur over the Salt and Wyoming Ranges to the east. We do have generators that are placed further west in Idaho that could potentially increase precipitation in Star Valley, but the increases will typically be minimal in the valley areas and more at higher elevations. It is also important to remember that cloud seeding augments snowfall. Let’s say that we could potentially increase snow by 10%, that would mean that if we had 10 inches of snow in Afton, only 1 inch of that would be from cloud seeding. When we originally began cloud seeding in the Payette Basin, we worked with snowplow operators to determine what the additional snow would have on their operations. They indicated to us that the additional little bit of snow didn’t affect what they were doing. If they already had to have plows out, it didn’t matter if they had to remove 9 or 10 inches of snow.
5. Who are the primary benefactors of the increased snowfall/runoff?
The primary benefactors are anyone that uses or depends upon water. As a power company, our hydro projects are downstream of numerous users. We are essentially at the end of the ditch so all others that are higher in the watershed use that water before it gets to us. To better understand how that additional water benefits groups, follow it downstream. By adding additional snow pack to a watershed, that watershed becomes healthier. There is more water available for plants and animals. The additional snow on the ground also helps with recreational uses such as snowmobiling, skiing, snowshoeing, etc. The increased snowpack also supplies additional runoff that provides better habitat for fish and recreational uses along the rivers such as fishing and white water sports. This additional water is then available for farmers to irrigate crops and for other municipal uses. The water that is left over then runs through Idaho Powers Hydroelectric generation facilities to create cheap, clean energy which helps to reduce electricity costs to our consumers.
6. How many meteorologists are involved in the project?
This year Idaho Power is using 3 internal full time meteorologists as well as a contract meteorologist that will be with us through the winter..
7. Are the NWS forecast offices in the area of seeding, Pocatello, Riverton and Boise, aware of when the seeding is going to be done so they can incorporate the enhanced snowfall into their forecasts?
On occasion we have worked with the various offices to supply information to them. We have given them access to some of our operational meteorological equipment, but we do not inform them when we are seeding.
8. I understand that contract soundings are conducted on request at the Afton Airport.
How many times in the course of a winter are these soundings taken and generally what time of day?
We roughly launch between 50-75 sounding per winter season (Nov – Apr). These soundings are at all times during the day. The intent is to give us near real time upper air data to support operations. Typically we launch a sounding before, or as the storm arrives, and then every 2-6 hrs during the storm. This information helps guide operational decisions. If a storm is fairly uniform, fewer soundings are used, but if the storm is evolving rapidly, we tend to launch more.
9. How high is data collected?
For the most part, the data that we are interested in is all below 500 mb(18,000 feet). That said, we have directed our operators to collect data up to 250 mb(34,000 feet) before cancelling the flight as long as the balloon is still gaining elevation.
10. Are these soundings available to the WFO’s that forecast for the region affected? Also could they be accessed by other interested parties?
In the past, we have forwarded them onto the NWS offices but haven’t done that in the past couple of years. We are currently working on a way to allow those interested in the data to have a way to receive the data. This database will also include all of our high resolution precipitation gauge data, ASOS information, radiometer data, and high resolution WRF model data. More on this as we work through internal hurdles as we develop this database.
An additional article about cloud seeding, primarily across Colorado can be accessed in the following link
Mountain News article on cloud seeding.
I was given an opportunity to submit questions about cloud seeding by Idaho Power as it relates to Star Valley. Derek Blestrud, one of the three Idaho Power meteorologist, responded with very informative answers.
Following are those questions and answers.
1. How long has Idaho Power been conducting cloud seeding?
Idaho Power first started looking into cloud seeding in the early 90’s in response to a question from a shareholder. After an extensive literature and climatology study, Idaho Power first contracted a cloud seeding program in the 96-97 winter seasons in the Payette River Basin north of Boise. The project was soon suspended due to excessive snowpack. In 2003, Idaho Power began operating its own cloud seeding project in the Payette River Basin. In 2008 Idaho Power began working with the High Country RC&D and expanded operations into the Upper Snake Region. In 2006 the State of Wyoming released the results of a Level II feasibility study evaluating cloud seeding potential in the Salt and Wyoming ranges. In 2010, Idaho Power working with the Western Wyoming RC&D to build upon Wyoming's feasibility study and began collecting weather data to further evaluate the feasibility of cloud seeding in the Salt and Wyoming Ranges of western Wyoming and began seeding in 2012. In 2013 Idaho Power conducted aircraft operations over the Wood River Basin of central Idaho. This year further expansion is being conducted into the Wood River Basin as well as the Boise River Basin.
 |
| Generators 17, 18, 19 and 20 affect the Salt and Wyoming Ranges directly |
2. How much increase in snowfall has been credited to the cloud seeding?
Determining the benefits of cloud seeding have a lot of variables. The main variable is targeting or lack thereof. This can be a function of cloud seeding generator spacing and elevation as well as aircraft operations and storm conditions. Never the less, literature shows that a well run wintertime orographic cloud seeding program can increase precipitation by 5 to 15%. Using a target/control analysis over the Payette target area since seeding began in 2003 has shown over a 14% increase during that time frame. Idaho Power is also working with the National Center for Atmospheric Research (NCAR) to develop a real-time cloud seeding model that simulates cloud seeding within a high resolution WRF model (1.8km). Currently this model is in the development state, but has shown values similar to what the target/control analysis is showing.
3. What are the ideal conditions to determine when to begin seeding?
Cloud seeding works best when there is an abundance of supercooled liquid water(SLW) within a storm system and a lack of ice nuclei as well as a wind direction that will provide enough orographic lift to transport the seeding agent into the storm system and areas of SLW. The most common time that this occurs is when there is a warmer wintertime storm system that is very shallow, does not have the upper cold portion of the cloud to feed ice crystals into the SLW layer. Silver iodide works best for cloud seeding between the temperatures of -5 to -15°C(23 to 5F) with the sweet spot between -8 and -10°C(18 to 14F). At warmer temperatures, freezing of the SLW is just too slow to produce precipitation increases with silver iodide. At cooler temperatures, the clouds become adequate in supplying the SLW layer with ice crystals to naturally seed the cloud.
4. How much affect does seeding have on the amount of snowfall in the populated areas of Star Valley vs the adjacent mountains?
This is somewhat of an unknown but we are working with NCAR to model increases from snowfall in a spatial form. The current thinking is that there are potentially some increase in Star Valley, but they are limited. The reason behind this is that we are growing snowflakes using the updraft produced from the mountains. This would occur over the Salt and Wyoming Ranges to the east. We do have generators that are placed further west in Idaho that could potentially increase precipitation in Star Valley, but the increases will typically be minimal in the valley areas and more at higher elevations. It is also important to remember that cloud seeding augments snowfall. Let’s say that we could potentially increase snow by 10%, that would mean that if we had 10 inches of snow in Afton, only 1 inch of that would be from cloud seeding. When we originally began cloud seeding in the Payette Basin, we worked with snowplow operators to determine what the additional snow would have on their operations. They indicated to us that the additional little bit of snow didn’t affect what they were doing. If they already had to have plows out, it didn’t matter if they had to remove 9 or 10 inches of snow.
5. Who are the primary benefactors of the increased snowfall/runoff?
The primary benefactors are anyone that uses or depends upon water. As a power company, our hydro projects are downstream of numerous users. We are essentially at the end of the ditch so all others that are higher in the watershed use that water before it gets to us. To better understand how that additional water benefits groups, follow it downstream. By adding additional snow pack to a watershed, that watershed becomes healthier. There is more water available for plants and animals. The additional snow on the ground also helps with recreational uses such as snowmobiling, skiing, snowshoeing, etc. The increased snowpack also supplies additional runoff that provides better habitat for fish and recreational uses along the rivers such as fishing and white water sports. This additional water is then available for farmers to irrigate crops and for other municipal uses. The water that is left over then runs through Idaho Powers Hydroelectric generation facilities to create cheap, clean energy which helps to reduce electricity costs to our consumers.
6. How many meteorologists are involved in the project?
This year Idaho Power is using 3 internal full time meteorologists as well as a contract meteorologist that will be with us through the winter..
7. Are the NWS forecast offices in the area of seeding, Pocatello, Riverton and Boise, aware of when the seeding is going to be done so they can incorporate the enhanced snowfall into their forecasts?
On occasion we have worked with the various offices to supply information to them. We have given them access to some of our operational meteorological equipment, but we do not inform them when we are seeding.
8. I understand that contract soundings are conducted on request at the Afton Airport.
How many times in the course of a winter are these soundings taken and generally what time of day?
We roughly launch between 50-75 sounding per winter season (Nov – Apr). These soundings are at all times during the day. The intent is to give us near real time upper air data to support operations. Typically we launch a sounding before, or as the storm arrives, and then every 2-6 hrs during the storm. This information helps guide operational decisions. If a storm is fairly uniform, fewer soundings are used, but if the storm is evolving rapidly, we tend to launch more.
9. How high is data collected?
For the most part, the data that we are interested in is all below 500 mb(18,000 feet). That said, we have directed our operators to collect data up to 250 mb(34,000 feet) before cancelling the flight as long as the balloon is still gaining elevation.
10. Are these soundings available to the WFO’s that forecast for the region affected? Also could they be accessed by other interested parties?
In the past, we have forwarded them onto the NWS offices but haven’t done that in the past couple of years. We are currently working on a way to allow those interested in the data to have a way to receive the data. This database will also include all of our high resolution precipitation gauge data, ASOS information, radiometer data, and high resolution WRF model data. More on this as we work through internal hurdles as we develop this database.
 |
| Cloud seeding generator on the east side of the Narrows on the Salt River |
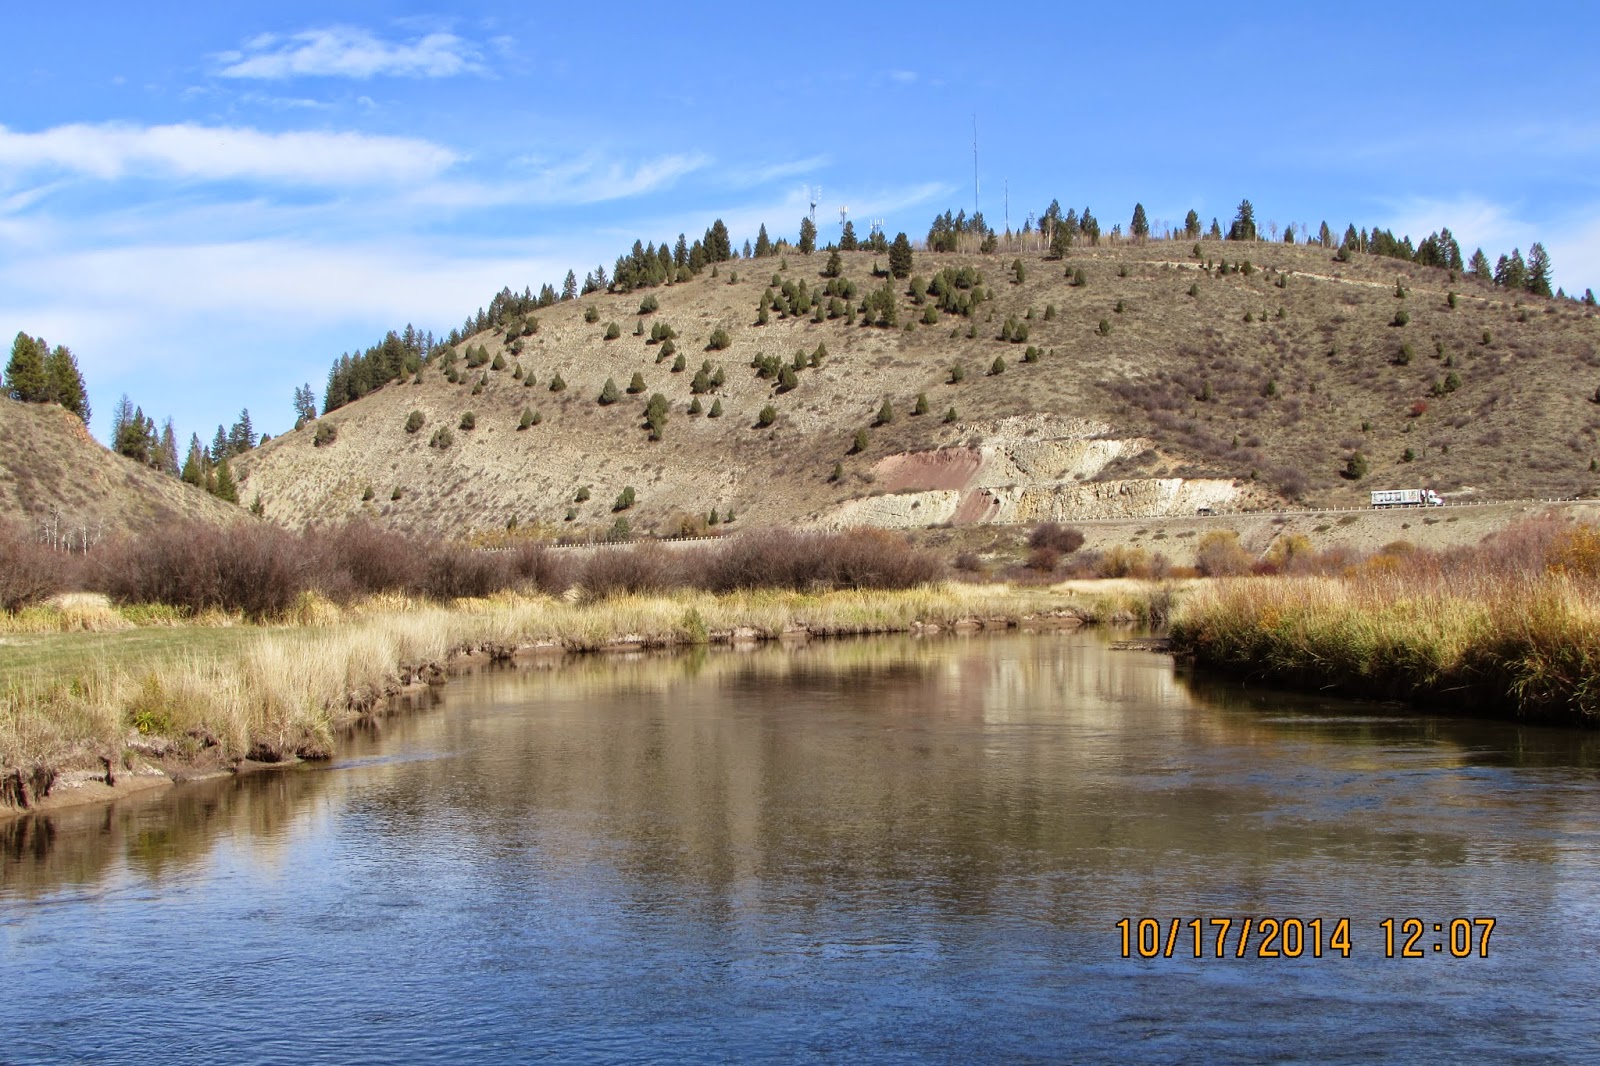 |
| Same view of generators from the Salt River near Auburn Bridge |
An additional article about cloud seeding, primarily across Colorado can be accessed in the following link
Mountain News article on cloud seeding.
Thursday, December 4, 2014
Weekly Weather Video Highlighting Mild December Weather
The Riverton Forecast Office Video Briefing discusses the coming mild weather.
Weekly Video Briefing
Weekly Video Briefing
Mild Weather Dominates Through Mid-December.
 |

For the same time period very wet conditions are expected along the west coast.

The latest model total forecast of precipitation which covers the period from December 4-20 is for as much as 15 inches in the Pacific Northwest with generally just around an inch or less in western Wyoming.

What this portends for Star Valley is daytime temperatures well above freezing with any precipitation predominantly rain or wet snow. Snowpack in the nearby mountains will likely not increase only gradually through the middle of December.

The normal temperature for Bedford and Star Valley as can be seen from the above climatological graph are near freezing in the afternoon and in the teens at night.
Dramatic Temperature Drop November 29-30 2014 in the Plains
Christopher Burt, Weather Historian for Weatherunderground has documented in his blog the dramatic temperature drop in the plain states over the Thanksgiving weekend.
Near Record Drop in Temperature in Plains November 29-30
By: Christopher C. Burt , 9:13 PM GMT on December 01, 2014
Near Record Drop in Temperature in Plains November 29-30
A cold front passed through Montana and Wyoming on Saturday November 29th and then pushed south and east over the Great Plains dropping temperatures as much as 70° in a matter of hours.

Temperature change over the 24-hour period from 3 p.m. November 29th to 3 p.m. November 30th. In fact, even greater falls of temperature occurred at various sites over different periods of time. Map graphic courtesy of The Weather Channel.
Nebraska saw the most pronounced temperature drops with York falling from an all-time late-season record high of 81°F at 1:35 p.m. on November 29th to 10° by 7:30 a.m. November 30th. An amazing 71° drop in just 18 hours! Other sites in the state saw similar drops: Norfolk from 77° (also a late-season record high) at 3 p.m. to 8° by 8 a.m. (a 69° fall in 17 hours), Hastings 80° (late-season record high) to 11° from 1 p.m. to 8 a.m., Grand Island from 78° to 10°, and Valentine 71° to 3° (1 p.m. to 6 a.m.).
Douglas, Wyoming fell 36° in one hour between 7 p.m.-8 p.m. on November 29th, from 52° to 16°. The temperature was 60° at 2 p.m. and 11° by 10 p.m. In Livingston, Montana the temperature fell 26° in sixminutes: 47° at 7:53 a.m. to 21° by 7:59 a.m.! By noon it was down to 6°. Bozeman, Montana dropped from 49° at 8 a.m. (November 29th) to -22° at 5:42 a.m. (November 30th), a 71° drop within 24 hours, similar to York in Nebraska.
Historical Perspective
Amazing as these figures are they do not represent all-time record temperature changes for the U.S. The famous cold front of November 11, 1911 was the most extreme such on record. On that day an intense cold front swept quickly across the Great Plains and Midwest where Kansas City, Missouri fell from 76° to 11° in 12 hours. Oklahoma City fell from 83° to 17° and Springfield, Missouri from 80° to 13°. In all three cases the cities recorded both their daily record high and daily record low temperature for November 11th.

The thermograph trace from Springfield, Missouri actually shows that the high temp was at least 81° on November 11th at around 3:45 pm. It also shows that by midnight that same day the temperature had fallen to 10°. The ‘official’ range of temperature for the day of 80° to 13° is not correct if the thermograph is accurate. The office only reported hourly temps for their daily summary and concluded that the 11 p.m. temp of 13° was the lowest for the day when, in fact, it had reached 10° by midnight. The 81° high also occurred between hourly reports. A drop of 40° occurred in 15 minutes between 3:45 p.m. and 4:00 p.m. was observed and the 71° drop in eight hours is almost unprecedented in meteorological records, although two locations in Arkansas (Rogers and Fayetteville) measured a 72° drop in temperature during the same period from 81° to 9°. Graphic from NWS-Springfield office.
Chicago dropped from 74° at 1pm to 13° by midnight on the 11th, and the Monthly Weather Reviewstated "one man was overcome by heat and two others frozen to death in the short space of 24 hours" (sounds like a little journalistic license here!).
The following is a table of the various state high temperatures observed on November 11, 1911 and state low temperatures observed on November 12th and 13th:

But THE greatest temperature drop for any single location in the U.S. (and the world) was that which occurred at Browning, Montana on January 23-24, 1916 where the thermometer plunged 100° in 24 hours: from 44° around midday on the 23rd to -56° by the morning of the 24th. Fairfield, Montana once saw its temperature fall 84° in just 12 hours on December 24, 1924, from 63° at noon to -21° by midnight.
Conversely, Montana also holds the world record for the fastest rise in temperature for a 24-hour period when a Chinook rose the temperature from -54° at 9 a.m. on January 14, 1972 to +49° by 8 a.m. on January 15th. A 103° rise, and the greatest change in temperature ever officially measured on earth within a 24-hour period. The NWS investigation of this event can be read here.

NWS COOP observer Jim Wood and his instrument shelter at Loma, Montana where the famous (and officially investigated) world-record 103°F change in temperature occurred on January 14-15, 1972. Photo courtesy of NWS-Great Falls.
Christopher C. Burt
Weather Historian
A cold front passed through Montana and Wyoming on Saturday November 29th and then pushed south and east over the Great Plains dropping temperatures as much as 70° in a matter of hours.
Temperature change over the 24-hour period from 3 p.m. November 29th to 3 p.m. November 30th. In fact, even greater falls of temperature occurred at various sites over different periods of time. Map graphic courtesy of The Weather Channel.
Nebraska saw the most pronounced temperature drops with York falling from an all-time late-season record high of 81°F at 1:35 p.m. on November 29th to 10° by 7:30 a.m. November 30th. An amazing 71° drop in just 18 hours! Other sites in the state saw similar drops: Norfolk from 77° (also a late-season record high) at 3 p.m. to 8° by 8 a.m. (a 69° fall in 17 hours), Hastings 80° (late-season record high) to 11° from 1 p.m. to 8 a.m., Grand Island from 78° to 10°, and Valentine 71° to 3° (1 p.m. to 6 a.m.).
Douglas, Wyoming fell 36° in one hour between 7 p.m.-8 p.m. on November 29th, from 52° to 16°. The temperature was 60° at 2 p.m. and 11° by 10 p.m. In Livingston, Montana the temperature fell 26° in sixminutes: 47° at 7:53 a.m. to 21° by 7:59 a.m.! By noon it was down to 6°. Bozeman, Montana dropped from 49° at 8 a.m. (November 29th) to -22° at 5:42 a.m. (November 30th), a 71° drop within 24 hours, similar to York in Nebraska.
Historical Perspective
Amazing as these figures are they do not represent all-time record temperature changes for the U.S. The famous cold front of November 11, 1911 was the most extreme such on record. On that day an intense cold front swept quickly across the Great Plains and Midwest where Kansas City, Missouri fell from 76° to 11° in 12 hours. Oklahoma City fell from 83° to 17° and Springfield, Missouri from 80° to 13°. In all three cases the cities recorded both their daily record high and daily record low temperature for November 11th.
The thermograph trace from Springfield, Missouri actually shows that the high temp was at least 81° on November 11th at around 3:45 pm. It also shows that by midnight that same day the temperature had fallen to 10°. The ‘official’ range of temperature for the day of 80° to 13° is not correct if the thermograph is accurate. The office only reported hourly temps for their daily summary and concluded that the 11 p.m. temp of 13° was the lowest for the day when, in fact, it had reached 10° by midnight. The 81° high also occurred between hourly reports. A drop of 40° occurred in 15 minutes between 3:45 p.m. and 4:00 p.m. was observed and the 71° drop in eight hours is almost unprecedented in meteorological records, although two locations in Arkansas (Rogers and Fayetteville) measured a 72° drop in temperature during the same period from 81° to 9°. Graphic from NWS-Springfield office.
Chicago dropped from 74° at 1pm to 13° by midnight on the 11th, and the Monthly Weather Reviewstated "one man was overcome by heat and two others frozen to death in the short space of 24 hours" (sounds like a little journalistic license here!).
The following is a table of the various state high temperatures observed on November 11, 1911 and state low temperatures observed on November 12th and 13th:
But THE greatest temperature drop for any single location in the U.S. (and the world) was that which occurred at Browning, Montana on January 23-24, 1916 where the thermometer plunged 100° in 24 hours: from 44° around midday on the 23rd to -56° by the morning of the 24th. Fairfield, Montana once saw its temperature fall 84° in just 12 hours on December 24, 1924, from 63° at noon to -21° by midnight.
Conversely, Montana also holds the world record for the fastest rise in temperature for a 24-hour period when a Chinook rose the temperature from -54° at 9 a.m. on January 14, 1972 to +49° by 8 a.m. on January 15th. A 103° rise, and the greatest change in temperature ever officially measured on earth within a 24-hour period. The NWS investigation of this event can be read here.
NWS COOP observer Jim Wood and his instrument shelter at Loma, Montana where the famous (and officially investigated) world-record 103°F change in temperature occurred on January 14-15, 1972. Photo courtesy of NWS-Great Falls.
Christopher C. Burt
Weather Historian
Wednesday, December 3, 2014
Updated Snow Totals Nov 24-26 2014
| Station Name | Snowfall | |||||||||||||||||||||||||||||||||||||||||||||||||||
|---|---|---|---|---|---|---|---|---|---|---|---|---|---|---|---|---|---|---|---|---|---|---|---|---|---|---|---|---|---|---|---|---|---|---|---|---|---|---|---|---|---|---|---|---|---|---|---|---|---|---|---|---|---|
| Big Horn | 26 E Lovell | 28 | |||||||||||||||||||||||||||||||||||||||||||||||||||
| Big Horn | Bald Mountain Snotel | 17 | |||||||||||||||||||||||||||||||||||||||||||||||||||
| Big Horn | Bone Springs Divide Snotel | 16 | |||||||||||||||||||||||||||||||||||||||||||||||||||
| Big Horn | Shell Creek Snotel | 12 | |||||||||||||||||||||||||||||||||||||||||||||||||||
| Big Horn | Shell | 12 | |||||||||||||||||||||||||||||||||||||||||||||||||||
| Big Horn | 2 SSW Lovell | 11 | |||||||||||||||||||||||||||||||||||||||||||||||||||
| Big Horn | Lovell | 10 | |||||||||||||||||||||||||||||||||||||||||||||||||||
| Big Horn | Basin | 9 | |||||||||||||||||||||||||||||||||||||||||||||||||||
| Big Horn | Greybull | 8.8 | |||||||||||||||||||||||||||||||||||||||||||||||||||
| Big Horn | Cowley | 8 | |||||||||||||||||||||||||||||||||||||||||||||||||||
| Big Horn | Deaver | 6.5 | |||||||||||||||||||||||||||||||||||||||||||||||||||
| Fremont | Brooks Lake | 21 | |||||||||||||||||||||||||||||||||||||||||||||||||||
| Fremont | Castle Creek Snotel | 10 | |||||||||||||||||||||||||||||||||||||||||||||||||||
| Fremont | Little Warm Snotel | 8 | |||||||||||||||||||||||||||||||||||||||||||||||||||
| Fremont | Cold Springs Snotel | 6 | |||||||||||||||||||||||||||||||||||||||||||||||||||
| Fremont | Burroughs Creek Snotel | 6 | |||||||||||||||||||||||||||||||||||||||||||||||||||
| Fremont | Hudson | 2.8 | |||||||||||||||||||||||||||||||||||||||||||||||||||
| Fremont | Dubois | 2 | |||||||||||||||||||||||||||||||||||||||||||||||||||
| Fremont | Riverton Airport | 1.8 | |||||||||||||||||||||||||||||||||||||||||||||||||||
| Fremont | Kinnear | 1 | |||||||||||||||||||||||||||||||||||||||||||||||||||
| Fremont | Hobbs Park Snotel | 1 | |||||||||||||||||||||||||||||||||||||||||||||||||||
| Fremont | Riverton | 1 | |||||||||||||||||||||||||||||||||||||||||||||||||||
| Fremont | Lander | 0.5 | |||||||||||||||||||||||||||||||||||||||||||||||||||
| Fremont | Lander Airport | 0.4 | |||||||||||||||||||||||||||||||||||||||||||||||||||
| Hot Springs | 9 NE Thermopolis | 2 | |||||||||||||||||||||||||||||||||||||||||||||||||||
| Hot Springs | Owl Creek Snotel | 2 | |||||||||||||||||||||||||||||||||||||||||||||||||||
| Hot Springs | 8 W Thermopolis | 1.5 | |||||||||||||||||||||||||||||||||||||||||||||||||||
| Johnson | Cloud Peak Reservoir Snotel | 13 | |||||||||||||||||||||||||||||||||||||||||||||||||||
| Johnson | Bear Trap Meadow Snotel | 11 | |||||||||||||||||||||||||||||||||||||||||||||||||||
| Johnson | Soldier Park Snotel | 8 | |||||||||||||||||||||||||||||||||||||||||||||||||||
| Johnson | Hansen Sawmill Snotel | 7 | |||||||||||||||||||||||||||||||||||||||||||||||||||
| Johnson | Little Goose Snotel | 6 | |||||||||||||||||||||||||||||||||||||||||||||||||||
| Johnson | 17 NNW Kaycee | 3 | |||||||||||||||||||||||||||||||||||||||||||||||||||
| Johnson | Buffalo | 2.5 | |||||||||||||||||||||||||||||||||||||||||||||||||||
| Natrona | Grave Spring Snotel | 8 | |||||||||||||||||||||||||||||||||||||||||||||||||||
| Natrona | Casper Mountain | 6 | |||||||||||||||||||||||||||||||||||||||||||||||||||
| Natrona | 11 ESE Casper | 5.4 | |||||||||||||||||||||||||||||||||||||||||||||||||||
| Natrona | Casper Mountain Snotel | 5 | |||||||||||||||||||||||||||||||||||||||||||||||||||
| Natrona | Casper | 4 to 4.5 | |||||||||||||||||||||||||||||||||||||||||||||||||||
| Natrona | 2 S Casper | 4 | |||||||||||||||||||||||||||||||||||||||||||||||||||
| Natrona | Midwest | 4 | |||||||||||||||||||||||||||||||||||||||||||||||||||
| Natrona | Reno Hill Snotel | 4 | |||||||||||||||||||||||||||||||||||||||||||||||||||
| Natrona | Casper Airport | 3.9 | |||||||||||||||||||||||||||||||||||||||||||||||||||
| Natrona | 2 S Casper | 3.8 | |||||||||||||||||||||||||||||||||||||||||||||||||||
| Natrona | 4 WSW Casper | 3.8 | |||||||||||||||||||||||||||||||||||||||||||||||||||
| Natrona | Powder River | 2.5 | |||||||||||||||||||||||||||||||||||||||||||||||||||
| Natrona | 2 SW Casper | 2 | |||||||||||||||||||||||||||||||||||||||||||||||||||
| Natrona | 11 WSW Casper | 1.5 | |||||||||||||||||||||||||||||||||||||||||||||||||||
| Park | Evening Star Snotel | 16 | |||||||||||||||||||||||||||||||||||||||||||||||||||
| Park | Wolverine Snotel | 13 | |||||||||||||||||||||||||||||||||||||||||||||||||||
| Park | Beartooth Lake Snotel | 13 | |||||||||||||||||||||||||||||||||||||||||||||||||||
| Park | Pahaska | 10 | |||||||||||||||||||||||||||||||||||||||||||||||||||
| Park | Blackwater Snotel | 9 | |||||||||||||||||||||||||||||||||||||||||||||||||||
| Park | Frannie | 7 | |||||||||||||||||||||||||||||||||||||||||||||||||||
| Park | 3 W Wapiti | 6.5 | |||||||||||||||||||||||||||||||||||||||||||||||||||
| Park | Wapiti | 6 | |||||||||||||||||||||||||||||||||||||||||||||||||||
| Park | Kirwin Snotel | 5 | |||||||||||||||||||||||||||||||||||||||||||||||||||
| Park | 3 SW Frannie | 5 | |||||||||||||||||||||||||||||||||||||||||||||||||||
| Park | Marquette Snotel | 4 | |||||||||||||||||||||||||||||||||||||||||||||||||||
| Park | 4 SW Powell | 3.7 | |||||||||||||||||||||||||||||||||||||||||||||||||||
| Park | Cody | 3.1 | |||||||||||||||||||||||||||||||||||||||||||||||||||
| Park | Timber Creek Snotel | 3 | |||||||||||||||||||||||||||||||||||||||||||||||||||
| Park | 3 N Powell | 3 | |||||||||||||||||||||||||||||||||||||||||||||||||||
| Park | 1 W Powell | 3 | |||||||||||||||||||||||||||||||||||||||||||||||||||
| Park | 3 NE Clark | 3 | |||||||||||||||||||||||||||||||||||||||||||||||||||
| Park | 4 SE Cody | 2.8 | |||||||||||||||||||||||||||||||||||||||||||||||||||
| Park | 3 NE Sunshine | 2.8 | |||||||||||||||||||||||||||||||||||||||||||||||||||
| Park | 26 SW Cody | 2.5 | |||||||||||||||||||||||||||||||||||||||||||||||||||
| Park | Meeteetse | 2.5 | |||||||||||||||||||||||||||||||||||||||||||||||||||
| Park | 2 WSW Cody | 2 | |||||||||||||||||||||||||||||||||||||||||||||||||||
| Sublette | Gunsite Pass Snotel | 14 | |||||||||||||||||||||||||||||||||||||||||||||||||||
| Sublette | Triple Peak Snotel | 14 | |||||||||||||||||||||||||||||||||||||||||||||||||||
| Sublette | Snider Basin Snotel | 13 | |||||||||||||||||||||||||||||||||||||||||||||||||||
| Sublette | Loomis Park Snotel | 12 | |||||||||||||||||||||||||||||||||||||||||||||||||||
| Sublette | East Rim Divide Snotel | 12 | |||||||||||||||||||||||||||||||||||||||||||||||||||
| Sublette | New Fork Lake Snotel | 11 | |||||||||||||||||||||||||||||||||||||||||||||||||||
| Sublette | Elkhart Park G.S. Snotel | 9 | |||||||||||||||||||||||||||||||||||||||||||||||||||
| Sublette | 14 NW Pinedale | 8.8 | |||||||||||||||||||||||||||||||||||||||||||||||||||
| Sublette | Daniel Fish Hatchery | 7 | |||||||||||||||||||||||||||||||||||||||||||||||||||
| Sublette | Kendall Ranger Station Snotel | 6 | |||||||||||||||||||||||||||||||||||||||||||||||||||
| Sublette | Pocket Creek Snotel | 6 | |||||||||||||||||||||||||||||||||||||||||||||||||||
| Sublette | Big Sandy Opening Snotel | 5 | |||||||||||||||||||||||||||||||||||||||||||||||||||
| Sublette | Pinedale | 4 | |||||||||||||||||||||||||||||||||||||||||||||||||||
| Sublette | Pinedale | 3.7 | |||||||||||||||||||||||||||||||||||||||||||||||||||
| Sublette | Larsen Creek Snotel | 3 | |||||||||||||||||||||||||||||||||||||||||||||||||||
| Sublette | 15 WNW Daniel | 1.8 | |||||||||||||||||||||||||||||||||||||||||||||||||||
| Sublette | Boulder Rearing Station | 1 | |||||||||||||||||||||||||||||||||||||||||||||||||||
| Teton | Grand Targhee Snotel | 28 | |||||||||||||||||||||||||||||||||||||||||||||||||||
| Teton | Jackson Hole-Rendezvous Bowl | 26 | |||||||||||||||||||||||||||||||||||||||||||||||||||
| Teton | Jackson Hole-Raymer | 25 | |||||||||||||||||||||||||||||||||||||||||||||||||||
| Teton | Jackson Hole-Mid | 24 | |||||||||||||||||||||||||||||||||||||||||||||||||||
| Teton | Togwotee Pass Snotel | 22 | |||||||||||||||||||||||||||||||||||||||||||||||||||
| Teton | Phillips Bench Snotel | 22 | |||||||||||||||||||||||||||||||||||||||||||||||||||
| Teton | Togwotee Mountain Lodge | 21 | |||||||||||||||||||||||||||||||||||||||||||||||||||
| Teton | Grand Targhee-Chief Joseph | 20 | |||||||||||||||||||||||||||||||||||||||||||||||||||
| Teton | Grassy Lake Snotel | 20 | |||||||||||||||||||||||||||||||||||||||||||||||||||
| Teton | Base Camp Snotel | 15 | |||||||||||||||||||||||||||||||||||||||||||||||||||
| Teton | Granite Creek Snotel | 12 | |||||||||||||||||||||||||||||||||||||||||||||||||||
| Teton | Snake River Stn Snotel | 12 | |||||||||||||||||||||||||||||||||||||||||||||||||||
| Teton | Snow King | 11 | |||||||||||||||||||||||||||||||||||||||||||||||||||
| Teton | Jackson Dam | 10 | |||||||||||||||||||||||||||||||||||||||||||||||||||
| Teton | 12 NE Jackson | 9 | |||||||||||||||||||||||||||||||||||||||||||||||||||
| Teton | Moose | 9 | |||||||||||||||||||||||||||||||||||||||||||||||||||
| Teton | Togwotee Pass | 9 | |||||||||||||||||||||||||||||||||||||||||||||||||||
| Teton | Jackson Hole-Base | 8 | |||||||||||||||||||||||||||||||||||||||||||||||||||
| Teton | 1 NNW Alta | 6 | |||||||||||||||||||||||||||||||||||||||||||||||||||
| Teton | 3 SSW Wilson | 6 | |||||||||||||||||||||||||||||||||||||||||||||||||||
| Teton | Jackson | 5 to 6 | |||||||||||||||||||||||||||||||||||||||||||||||||||
| Teton | 2 NE Teton Village | 5.5 | |||||||||||||||||||||||||||||||||||||||||||||||||||
| Teton | Gros Ventre Summit Snotel | 5 | |||||||||||||||||||||||||||||||||||||||||||||||||||
| Teton | 5 NW Jackson | 4.5 | |||||||||||||||||||||||||||||||||||||||||||||||||||
| Teton | Darwin Ranch | 1.6 | |||||||||||||||||||||||||||||||||||||||||||||||||||
| Washakie | Powder River Pass Snotel | 15 | |||||||||||||||||||||||||||||||||||||||||||||||||||
| Washakie | Middle Powder Snotel | 13 | |||||||||||||||||||||||||||||||||||||||||||||||||||
| Washakie | 5 NNW Ten Sleep | 10.5 | |||||||||||||||||||||||||||||||||||||||||||||||||||
| Washakie | Ten Sleep | 8.5 | |||||||||||||||||||||||||||||||||||||||||||||||||||
| Washakie | 16 SSE Ten Sleep | 8 | |||||||||||||||||||||||||||||||||||||||||||||||||||
| Washakie | 27 S Ten Sleep | 6.2 | |||||||||||||||||||||||||||||||||||||||||||||||||||
| Washakie | Worland | 5 | |||||||||||||||||||||||||||||||||||||||||||||||||||
| Washakie | 8 SW Worland | 3 | |||||||||||||||||||||||||||||||||||||||||||||||||||
| Washakie | Winchester | 2 | |||||||||||||||||||||||||||||||||||||||||||||||||||
| Yellowstone | Lamar Ranger Station | 15.8 | |||||||||||||||||||||||||||||||||||||||||||||||||||
| Yellowstone | Sylvan Road Snotel | 11 | |||||||||||||||||||||||||||||||||||||||||||||||||||
| Yellowstone | Two Ocean Plateau Snotel | 11 | |||||||||||||||||||||||||||||||||||||||||||||||||||
| Yellowstone | Parker Peak Snotel | 8 | |||||||||||||||||||||||||||||||||||||||||||||||||||
| Yellowstone | Canyon Snotel | 8 | |||||||||||||||||||||||||||||||||||||||||||||||||||
| Yellowstone | Sylvan Lake Snotel | 8 | |||||||||||||||||||||||||||||||||||||||||||||||||||
| Yellowstone | Lewis Lake Divide Snotel | 6 | |||||||||||||||||||||||||||||||||||||||||||||||||||
| Yellowstone | Old Faithful Ranger Station | 5.5 | |||||||||||||||||||||||||||||||||||||||||||||||||||
| Yellowstone | Thumb Divide Snotel | 5 | |||||||||||||||||||||||||||||||||||||||||||||||||||
| Yellowstone | Yellowstone East Entrance | 4 | |||||||||||||||||||||||||||||||||||||||||||||||||||
| Yellowstone | Tower Falls Ranger Station | 2.5 |
Tuesday, November 25, 2014
Latest Snowfall Totals
NATIONAL WEATHER SERVICE RIVERTON WY
740 PM MST TUE NOV 25 2014

SNOW FELL ACROSS WESTERN AND CENTRAL WYOMING LAST
NIGHT AND THROUGH THE DAY INTO THIS EVENING.
HERE ARE SOME SNOWFALL REPORTS SO FAR. MANY MORE
REPORTS WILL COME IN WEDNESDAY MORNING.

LOCATION                             SNOWFALL
LINCOLN COUNTY...
 SPRING CREEK DIVIDE SNOTEL...       17 INCHES.
 ALPINE...                           15 INCHES.
 WILLOW CREEK SNOTEL...              14 INCHES.
 COTTONWOOD CREEK SNOTEL...          12 INCHES.
 SALT RIVER SUMMIT SNOTEL...         10 INCHES.
 BLIND BULL SUMMIT SNOTEL...         10 INCHES.
 INDIAN CREEK SNOTEL...               9 INCHES.
 KELLEY RANGER STATION SNOTEL...      7 INCHES.
 ALPINE...                            7 INCHES.
 STAR VALLEY RANCH...                 6 INCHES.
 AFTON...                             5 INCHES.
 HAMS FORK SNOTEL...                  5 INCHES.
 5 SSE SMOOT...                       4 INCHES.
 2 SE THAYNE...                     3.7 INCHES.
 BOX Y RANCH...                       3 INCHES.
 AFTON...                           2.1 INCHES.
 BLIND BULL SUMMIT...                 2 INCHES.
 COMMISSARY RIDGE...                  1 INCH.
 FOSSIL BUTTE...                    0.5 INCHES.
BIG HORN COUNTY...
 26 E LOVELL...                      11 INCHES.
 BALD MOUNTAIN SNOTEL...             10 INCHES.
 BONE SPRINGS DIVIDE SNOTEL...       10 INCHES.
 BASIN...                             9 INCHES.
 SHELL CREEK SNOTEL...                8 INCHES.
 COWLEY...                            8 INCHES.
 1 E GREYBULL...                    6.6 INCHES.
 LOVELL...                            6 INCHES.

FREMONT COUNTY...
 COLD SPRINGS SNOTEL...               5 INCHES.
 LITTLE WARM SNOTEL...                4 INCHES.
 CASTLE CREEK SNOTEL...               4 INCHES.
 BURROUGHS CREEK SNOTEL...            3 INCHES.
 BROOKS LAKE...                       3 INCHES.
 HOBBS PARK SNOTEL...                 1 INCH.

HOT SPRINGS COUNTY...
 OWL CREEK SNOTEL...                  1 INCH.

JOHNSON COUNTY...
 CLOUD PEAK RESERVOIR SNOTEL...       5 INCHES.
 BEAR TRAP MEADOW SNOTEL...           5 INCHES.
 HANSEN SAWMILL SNOTEL...             3 INCHES.
 BUFFALO...                         2.5 INCHES.
 SOLDIER PARK SNOTEL...               2 INCHES.
 LITTLE GOOSE SNOTEL...               2 INCHES.


NATRONA COUNTY...
 GRAVE SPRING SNOTEL...               3 INCHES.
 MIDWEST...                         0.5 INCHES.

PARK COUNTY...
 EVENING STAR SNOTEL...              13 INCHES.
 WOLVERINE SNOTEL...                 11 INCHES.
 BEARTOOTH LAKE SNOTEL...             9 INCHES.
 BLACKWATER SNOTEL...                 8 INCHES.
 FRANNIE...                           7 INCHES.
 WAPITI...                            6 INCHES.
 3 SW FRANNIE...                      5 INCHES.
 PAHASKA...                           5 INCHES.
 MARQUETTE SNOTEL...                  4 INCHES.
 KIRWIN SNOTEL...                     3 INCHES.
 1 W POWELL...                      1.5 INCHES.
 TIMBER CREEK SNOTEL...               1 INCH.

SUBLETTE COUNTY...
 TRIPLE PEAK SNOTEL...               10 INCHES.
 EAST RIM DIVIDE SNOTEL...            9 INCHES.
 SNIDER BASIN SNOTEL...               9 INCHES.
 LOOMIS PARK SNOTEL...                7 INCHES.
 NEW FORK LAKE SNOTEL...              5 INCHES.
 PINEDALE...                          4 INCHES.
 GUNSITE PASS SNOTEL...               4 INCHES.
 KENDALL RANGER STATION SNOTEL...     4 INCHES.
 ELKHART PARK G.S. SNOTEL...          3 INCHES.
 POCKET CREEK SNOTEL...               3 INCHES.
 BIG SANDY OPENING SNOTEL...          3 INCHES.
 15 WNW DANIEL...                   1.8 INCHES.
 DANIEL FISH HATCHERY...              1 INCH.
 LARSEN CREEK SNOTEL...               1 INCH.
 14 NW PINEDALE...                    1 INCH.

TETON COUNTY...
 GRAND TARGHEE SNOTEL...             20 INCHES.
 PHILLIPS BENCH SNOTEL...            20 INCHES.
 TOGWOTEE MOUNTAIN LODGE...          14 INCHES.
 BASE CAMP SNOTEL...                 13 INCHES.
 JACKSON HOLE-RENDEZVOUS BOWL...     13 INCHES.
 TOGWOTEE PASS SNOTEL...             12 INCHES.
 JACKSON HOLE-MID...                 12 INCHES.
 SNAKE RIVER STN SNOTEL...           10 INCHES.
 GRANITE CREEK SNOTEL...             10 INCHES.
 JACKSON HOLE-RAYMER...              10 INCHES.
 TOGWOTEE PASS...                     9 INCHES.
 12 NE JACKSON...                     7 INCHES.
 JACKSON...                      5 TO 6 INCHES.
 MOOSE...                             6 INCHES.
 JACKSON DAM...                     5.5 INCHES.
 5 NW JACKSON...                    4.5 INCHES.
 3 SSW WILSON...                      4 INCHES.
 GRAND TARGHEE-CHIEF JOSEPH...        4 INCHES.
 2 NE TETON VILLAGE...                3 INCHES.
 JACKSON HOLE-BASE...                 3 INCHES.
 SNOW KING...                         1 INCH.
 GROS VENTRE SUMMIT SNOTEL...         1 INCH.

WASHAKIE COUNTY...
 POWDER RIVER PASS SNOTEL...          8 INCHES.
 MIDDLE POWDER SNOTEL...              3 INCHES.

YELLOWSTONE NATIONAL PARK...
 SYLVAN ROAD SNOTEL...                9 INCHES.
 TWO OCEAN PLATEAU SNOTEL...          8 INCHES.
 SYLVAN LAKE SNOTEL...                6 INCHES.
 CANYON SNOTEL...                     6 INCHES.
 PARKER PEAK SNOTEL...                5 INCHES.
 OLD FAITHFUL RANGER STATION...     4.5 INCHES.
 THUMB DIVIDE SNOTEL...               4 INCHES.
 YELLOWSTONE EAST ENTRANCE...         4 INCHES.
 LEWIS LAKE DIVIDE SNOTEL...          4 INCHES.
 TOWER FALLS RANGER STATION...      2.5 INCHES.
 LAMAR RANGER STATION...              2 INCHES.


...HERE ARE PEAK WIND SPEEDS THAT OCCURRED LAST
NIGHT AND TODAY ACROSS REGION...

LOCATION                       SPEED     TIME/DATE

...WYOMING...

...FREMONT...
7 SW MUDDY GAP (7380 FT)       74 MPH    0550 AM 11/25
2 W SOUTH PASS CITY (8185 FT)  57 MPH    0511 AM 11/25
10 W FORT WASHAKIE (9235 FT)   57 MPH    0501 AM 11/25
10 N DUBOIS (8085 FT)          49 MPH    0357 AM 11/25
DUBOIS (6980 FT)               47 MPH    0657 AM 11/25
11 NE RIVERTON (5016 FT)       44 MPH    0113 PM 11/25
RIVERTON AIRPORT (5525 FT)     43 MPH    1106 PM 11/24
8 W SOUTH PASS CITY (8120 FT)  43 MPH    0550 AM 11/25
BEAVER RIM (6784 FT)           41 MPH    0556 AM 11/25
CROWHEART (6099 FT)            40 MPH    1126 PM 11/24

...JOHNSON...
BUFFALO AIRPORT (4970 FT)      49 MPH    0356 PM 11/25
5 ESE STORY (4673 FT)          45 MPH    0346 PM 11/25
13 NNW BUFFALO (4737 FT)       44 MPH    0115 PM 11/25
7 SW BARNUM (6440 FT)          44 MPH    0646 AM 11/25

...LINCOLN...
KEMMERER AIRPORT (7285 FT)     55 MPH    0235 PM 11/25
13 W KEMMERER (6718 FT)        45 MPH    1225 PM 11/25
9 N KEMMERER (7129 FT)         43 MPH    0117 PM 11/25

...NATRONA...
16 S HILAND (6380 FT)          45 MPH    0910 AM 11/25
CASPER AIRPORT (5320 FT)       43 MPH    0554 AM 11/25

...PARK...
5 WNW CLARK (4659 FT)          92 MPH    0410 AM 11/25
CHIEF JOSEPH HWY (8136 FT)     60 MPH    1230 AM 11/25
CODY AIRPORT (5100 FT)         56 MPH    1215 AM 11/25
1 W CLARK (4270 FT)            49 MPH    0348 AM 11/25
10 WNW CODY (8401 FT)          47 MPH    0340 AM 11/25
3 E PAHASKA (7500 FT)          46 MPH    1157 AM 11/25
8 N MEETEETSE (5926 FT)        46 MPH    0141 PM 11/25
1 WNW POWELL (4386 FT)         44 MPH    0545 AM 11/25
3 W POWELL (4505 FT)           41 MPH    0548 AM 11/25

...SUBLETTE...
21 W BIG PINEY (8200 FT)       56 MPH    1209 AM 11/25

...SWEETWATER...
15 SE ROCK SPRINGS (7550 FT)   59 MPH    0944 AM 11/25
I 80 - MILE MARKER 142         53 MPH    0100 PM 11/25
I 80 - MILE MARKER 157         52 MPH    0140 PM 11/25
7 WSW ROCK SPRINGS (6238 FT)   50 MPH    0140 PM 11/25
5 E ROCK SPRINGS (6369 FT)     49 MPH    0620 AM 11/25
MCKINNON (7086 FT)             49 MPH    1031 AM 11/25
22 NNE GRANGER (6322 FT)       49 MPH    1058 AM 11/25
ROCK SPRINGS AIRPORT (6760 FT) 48 MPH    0812 AM 11/25
I 80 - MILE MARKER 124         46 MPH    1256 PM 11/25
7 WNW GREEN RIVER (6387 FT)    46 MPH    0132 PM 11/25
I 80 - MILE MARKER 184         45 MPH    0256 PM 11/25
1 NNE GREEN RIVER (6315 FT)    45 MPH    1252 PM 11/25
I 80 - MILE MARKER 131         43 MPH    0225 PM 11/25
FARSON (6594 FT)               41 MPH    0150 PM 11/25

...TETON...
SUMMIT - JACKSON RESORT        61 MPH    0930 AM 11/25
Subscribe to:
Posts (Atom)