Most every American has some basis to complain about unpredictable weather. As a mid-latitude country with shining seas and majestic mountain ranges and fruited, wind-swept plains, we’re subject to pretty much every type of weather meteorologists have thought to identify. So perhaps you’ve heard the
line: “If you don’t like the weather in Chicago, wait five minutes.” Or you’ve heard it applied to a city nearer to you:
Denver or
San Francisco or
Atlanta or
Boston.
But where in the country is the weather truly the most unpredictable?
We’re going to answer this question in a specific way, by comparing daily weather patterns against long-term averages. We’ll define the weather as being more unpredictable when it deviates more from these long-term trends.
Meteorologists call these long-term averages
climatology. Weather forecasting has moved beyond climatology to embrace more sophisticated techniques, but in some cities climatology does extremely well on its own. Take the case of Phoenix, for example. The chart below compares high temperatures in Phoenix on each day from 2011 through 2013 against the 20-year average for the week in question. On a typical day in Phoenix, the high temperature deviated from the long-term average by only 5 to 6 degrees. You could plan a wedding or golf tournament in Phoenix years in advance and be reasonably confident of what the temperature would be.
This wouldn’t be true for Denver. Over the past three years, climatology has missed the high temperature there by 9 to 10 degrees on average. And misses of 20 degrees or more, which almost never happen in Phoenix, have occurred, on average, once every other week in Denver.
Get the drift? We’ll do this for 120 American cities, one representative from each of the
120 National Weather Service forecast offices across the 50 states. (Generally, we used data from the largest airport-based weather station in the area.) And we’ll be doing it for 10 weather statistics rather than just high temperatures. We can then combine the statistics into an overall measure of weather unpredictability for each city.
As a reminder, our goal is to evaluate how unpredictable the weather is — rather than whether the weather is good or bad. In San Diego, to a first approximation, it’s always 72 degrees and sunny. In Seattle, to a first approximation, it’s always 59 degrees and drizzly. Most people like San Diego’s weather better, but both cities have fairly predictable weather patterns.
Nor are we concerned about how much the weather varies throughout the year — provided it does so predictably. As a matter of practice, cities with high seasonal volatility usually also have high day-to-day unpredictability, but there are exceptions. Phoenix, for instance, has pronounced seasonal variation in its temperatures (the average high temperature there is 67 degrees in January and 106 degrees in August) but the daily values don’t deviate much around those seasonal averages. So its temperatures rate as predictable. Similarly, a city that routinely has thunderstorms in the spring but rarely throughout the rest of the year will rate as having more predictable weather than one where storms can occur at any time.
The statistics we’ll be evaluating fall into three major categories.
First, temperature:
- High temperatures;
- Low temperatures;
- Daily mean temperatures.
Second, precipitation:
- Rainfall, in inches;
- Snowfall, in inches of snow (rather than the liquid equivalent);
- A binary variable indicating the presence or absence of precipitation (without regard to the type or amount of it). If there’s any precipitation at all over the 24-hour day, we score this variable as one. Otherwise, it’s zero.
Finally, severe weather and the conditions that contribute to it:
- Wind speed;
- Humidity;
- Cloud cover;
- A binary variable indicating whether there was a severe weather event (a thunderstorm, tornado or hail) in the city that day.
We scrubbed the data to identify extreme outliers and obvious data-entry errors and removed them before calculating the weekly averages. Then we calculated the
root-mean-square deviation for each variable. Because all the statistics are on different scales — degrees Fahrenheit for temperature, mph for wind speed — we
standardized them onto a common scale before averaging them together.
That was a bit of work, but it allowed us to generate this fun map:
Among the cities we tested, the one with the most unpredictable weather is … Rapid City, South Dakota. Congratulations, Rapid City!
The ICAO code for Rapid City Regional Airport is
KRAP. That’s also a good description of Rapid City’s weather. Its temperature might be 30 degrees in January — or just as easily -12. It’s snowy and windy and prone to
big, unexpected winter storms. And it has a thunderstorm on almost 25 percent of days from July through September, more than the national average.
But Rapid City isn’t alone; other cities in the Great Plains and Upper Midwest dominate the most-unpredictable list. After Rapid City, those with the most unpredictable weather are Great Falls, Montana; Houghton, Michigan; Sioux Falls, South Dakota; Fargo, North Dakota; Duluth, Minnesota; Bismarck, North Dakota; Aberdeen, South Dakota; Grand Island, Nebraska; and Glasgow, Montana.
For the most part, these cities are landlocked. The presence of lakes or oceans can contribute to weather problems — for instance, the
huge amounts of lake-effect snow in Houghton, in Michigan’s Upper Peninsula (about twice as much as in notoriously snowy Buffalo, New York). But water usually does more to regulate temperatures and severe weather.
The other common thread between these cities is that not very many people live in them. Indeed, among the top 23 cities on our list, none are within the
50 most populous metro areas in the United States. Among cities that do fall within the most populous metro areas, those with the most unpredictable weather are as follows:
- Kansas City, Missouri;
- Oklahoma City;
- Minneapolis;
- Cincinnati;
- Indianapolis;
- St. Louis;
- Birmingham, Alabama;
- Boston;
- Milwaukee;
- Dallas.
This list, too, is dominated by landlocked cities in the Midwest (depending on how you
define the region). There are a smattering of northeastern cities and a few landlocked cities in the South.
To get more insight into the source of these differences, we can break the ratings down into their three major subcomponents: temperature, precipitation and severe weather. Here’s the map for temperature unpredictability:
You can easily make out the
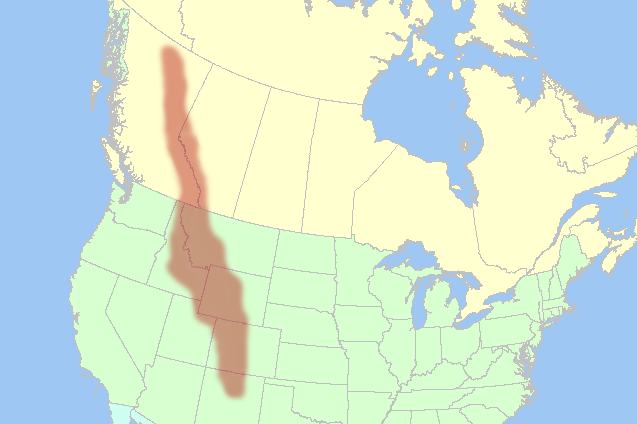
path of the Rocky Mountains in this map. Cities just to the east of them — like Denver and Great Falls, Montana — have much more unpredictable temperatures than almost any place to the west of them.
Cities just to the east of the Pacific Ocean and the Gulf of Mexico have the most predictable temperatures. San Diego’s temperatures are the most predictable of anywhere in the continental United States (Honolulu’s are the most predictable overall). Seattle and San Francisco have highly predictable temperatures, as does the Florida peninsula.
The map of unpredictable precipitation patterns is dominated by cities in the eastern half of the country:
Nothing tops Houghton, which gets about twice as much snow as any other city we evaluated and can also be reasonably rainy in the summer.
But why don’t notoriously wet cities like Seattle and Portland, Oregon, rank higher? Both have precipitation fairly often; Seattle ranks eighth in the country (out of the 120 cities we tracked) by the number of days with precipitation, and Portland ranks ninth. But they usually have light precipitation. Between 1994 and 2013, Portland got at least an inch of rain only 1.2 percent of the time, for example, as compared with 2.1 percent of the time for the average U.S. city. Their precipitation patterns are also quite seasonal, making them more predictable. Seattle has historically received precipitation on 71 percent of days in January but just 19 percent of days in July.
If you want to have an easy life as a weather forecaster, you should get a job in Las Vegas, Phoenix or Los Angeles. Predict that it won’t rain in one of those cities, and you’ll be right about 90 percent of the time.
The frequency of severe weather conditions is more idiosyncratic than the presence of precipitation in general. But the map of areas most prone to unpredictable, severe weather generally follows
Tornado Alley, with cities in the line of states from South Dakota through Oklahoma and northern Texas ranking toward the top of the list.
Oceans and lakes tend to reduce severe weather frequency and make its occurrence more predictable. There are some exceptions, however — especially the Atlantic Seaboard from North Carolina through Maine. Cities like Boston and New York don’t have many thunderstorms, but they have fairly unpredictable wind patterns and humidity levels. Those can scale up the severity of a storm in a hurry, especially in the winter months.
Want a more precise estimate of where your city ranks? As we mentioned before, we translated the 10 weather conditions onto a common scale; specifically, it’s a common scale where 66 represents average. Why 66? Because it should be an intuitive value when we’re looking at weather data. The high temperature for the 120 weather stations we tracked was about 66 degrees, on average, throughout the year.
Higher values indicate more unpredictability:
- Scores in the 80s or above indicate very high unpredictability.
- Scores in the 70s indicate above-average unpredictability.
- Scores in the 60s indicate average unpredictability.
- Scores in the 50s indicate comparatively predictable weather patterns.
- Scores in the 40s or below indicate highly predictable weather.
There are some limitations to our method. It reflects day-to-day rather than hour-to-hour unpredictability, for instance. And perhaps the weather is more unpredictable within particular
microclimates than at the airport-based weather stations we’ve tracked. Still, a few cities with a reputation for unpredictable weather rank lower than you might expect:
- San Francisco’s weather patterns are unusual as compared to the rest of the country (September has historically been San Francisco’s warmest month, for instance). But they’re predictably unusual, at least on a day-to-day (if not necessarily hour-to-hour) basis. And San Francisco, like the rest of the West Coast, rarely gets severe weather.
- Chicago’s weather is slightly more unpredictable than average but not more than that. It has distinct seasons, and considerable temperature fluctuations, especially in the spring. But it doesn’t have especially unpredictable severe weather or precipitation patterns. It isn’t all that windy, despite its nickname, and it very rarely gets lake-effect snow since the wind usually blows west to east across Lake Michigan rather than into Chicago.
- Buffalo does get plenty of lake-effect snow and has unpredictable wind patterns. But its humidity levels and cloud cover patterns are fairly predictable, which cuts down on severe weather outside the winter and early spring.
- Denver, although it has among the most unpredictable high temperatures in the country and can have bouts of severe weather, has fairly predictable rainfall patterns (there usually isn’t much) and cloud cover (it’s usually sunny). And its problems tend to be concentrated in spring; summer days in Denver are often predictably mild.
These cities still have plenty of unpredictable weather. But if you don’t like the weather in Chicago or Denver, be thankful you don’t have to deal with the KRAP they have in Rapid City.