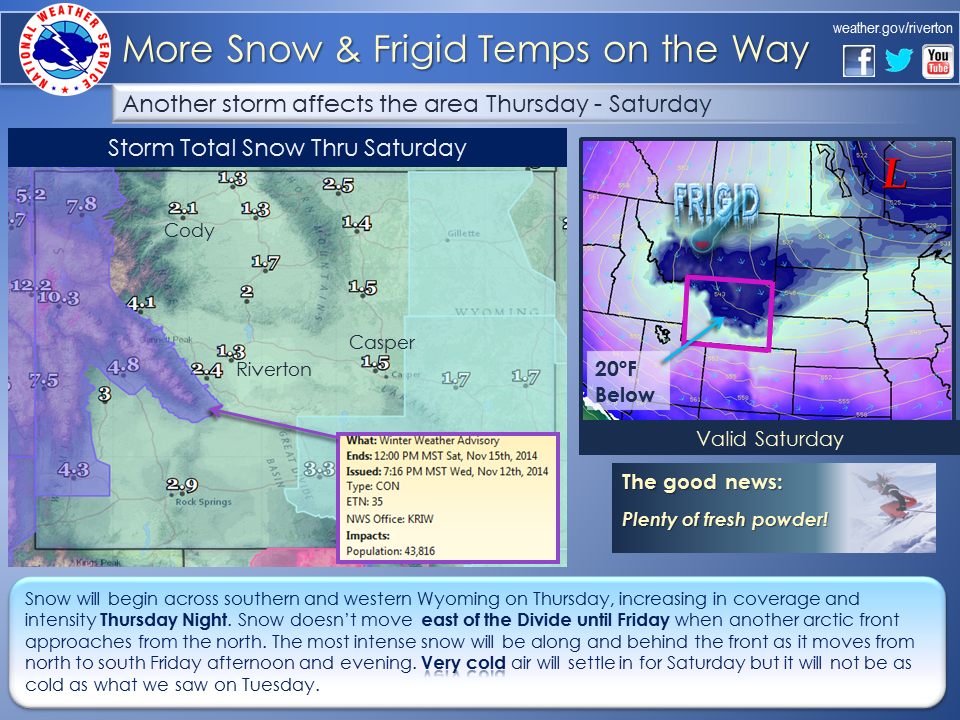
Wednesday, November 12, 2014


Monday, November 10, 2014
Snowfall as of Noon Monday November 10 2014
PUBLIC INFORMATION STATEMENT
NATIONAL WEATHER SERVICE RIVERTON WY
209 PM MST MON NOV 10 2014

...PRELIMINARY SNOWFALL INFORMATION...

AN ARCTIC COLD FRONT MOVED ACROSS THE COWBOY STATE THIS MORNING
WHICH BROUGHT A DRAMATIC DROP IN TEMPERATURES...BRISK NORTH WINDS
AND SNOW TO THE REGION. THE FOLLOWING SNOWFALL REPORTS ARE THROUGH
11 AM THIS MORNING.

LOCATION                             SNOWFALL
LINCOLN COUNTY...SPRING CREEK DIVIDE SNOTEL... 6 INCHES. BLIND BULL SUMMIT SNOTEL... 4 INCHES. STAR VALLEY RANCH... 1 INCH.BIG HORN COUNTY... SHELL CREEK SNOTEL... 5 INCHES. 2 SSW LOVELL... 2 INCHES. SHELL... 2 INCHES. FREMONT COUNTY... HOBBS PARK SNOTEL... 6 INCHES. LANDER AIRPORT... 6 INCHES. COLD SPRINGS SNOTEL... 6 INCHES. LITTLE WARM SNOTEL... 5 INCHES. TOWNSEND CREEK SNOTEL... 4 INCHES. DUBOIS... 3 INCHES. 1 SW LANDER... 3 INCHES. SOUTH PASS SNOTEL... 2 INCHES. RIVERTON... 2 INCHES. BURROUGHS CREEK SNOTEL... 2 INCHES. RIVERTON AIRPORT... 1.5 INCHES. BURRIS... 1 INCH. LANDER... 1 INCH. HUDSON... 0.5 INCHES. HOT SPRINGS COUNTY... THERMOPOLIS... 8 TO 6 INCHES. OWL CREEK SNOTEL... 4 INCHES. LUCERNE... 3.5 INCHES. KIRBY... 2 INCHES. HAMILTON DOME... 1 INCH. JOHNSON COUNTY... CLOUD PEAK RESERVOIR SNOTEL... 11 INCHES. 17 NNW KAYCEE... 8 INCHES. HANSEN SAWMILL SNOTEL... 6 INCHES. SOLDIER PARK SNOTEL... 4 INCHES. BEAR TRAP MEADOW SNOTEL... 3 INCHES. 4 SSW BUFFALO... 2.5 INCHES. BUFFALO... 1 TO 2 INCHES. NATRONA COUNTY... CASPER AIRPORT... 4 INCHES. CASPER... 2 TO 4 INCHES. POWDER RIVER... 3 INCHES. 4 WSW CASPER... 2.5 INCHES. CASPER MOUNTAIN SNOTEL... 2 INCHES. 5 SSW CASPER... 2 INCHES. 4 SW CASPER... 2 INCHES. 10 WSW CASPER... 1.5 INCHES. MIDWEST... 1 INCH. PARK COUNTY... BEARTOOTH LAKE SNOTEL... 9 INCHES. TIMBER CREEK SNOTEL... 6 INCHES. 3 NE SUNSHINE... 6 INCHES. 5 ESE CODY... 2.5 INCHES. PAHASKA... 1 INCH. 3 NE CLARK... 1 INCH. 2 WSW CODY... 1 INCH. 4 SE CODY... 0.5 INCHES. SUBLETTE COUNTY... TRIPLE PEAK SNOTEL... 4 INCHES. BIG SANDY OPENING SNOTEL... 4 INCHES. PINEDALE... 1 INCH. 6 NNW DANIEL... 1 INCH. SWEETWATER COUNTY... TETON COUNTY... GRAND TARGHEE SNOTEL... 11 INCHES. TOGWOTEE PASS SNOTEL... 10 INCHES. 12 NE JACKSON... 4 INCHES. MOOSE... 3 INCHES. JACKSON... 1.5 INCHES. WASHAKIE COUNTY... POWDER RIVER PASS SNOTEL... 7 INCHES. WINCHESTER... 5 INCHES. 5 NNW TEN SLEEP... 4.6 INCHES. TEN SLEEP... 4 INCHES. MIDDLE POWDER SNOTEL... 4 INCHES. 16 SSE TEN SLEEP... 4 INCHES. 8 SW WORLAND... 3 INCHES. YELLOWSTONE NATIONAL PARK... TWO OCEAN PLATEAU SNOTEL... 8 INCHES. PARKER PEAK SNOTEL... 7 INCHES. CANYON SNOTEL... 3 INCHES. TOWER FALLS RANGER STATION... 1 INCH. $$ TEAM RIVERTON
Sunday, November 9, 2014
Superstorm in the Bering Sea
Chistopher Burt, weather historian, for WeatherUnderground, recently blogged the amazingly powerful storm over the Bering Sea on Nov 7-8 2014.
Bering Sea Superstorm Bottoms out at 924 mb
By: Christopher C. Burt , 8:52 PM GMT on November 08, 2014
Bering Sea Superstorm Bottoms out at 924 mb
One of the most powerful extra-tropical storms ever to pass through the Bering Sea reportedly attained a central pressure as low as 924 mb (27.29”) on Friday night/Saturday morning local time. This may rank as the lowest pressure ever ‘analyzed’ (estimated) in the Pacific Basin from an extra-tropical storm system.

The surface map for 06Z on Saturday, November 8th indicates a central pressure of 924 mb off the coast of Siberia in the Bering Sea. The lowest pressure actually measured so far is 929.8 mb at 02Z by a buoy drifting at 55.1°N, 170.7°E. Amazingly, the pressure at this buoy fell 37.3 mb (about 1.10”) in just 6 six hours between 16Z and 22Z on Friday, November 7th! Map from NWS-Anchorage.

Satellite image of the storm at 12Z on Saturday morning soon after it reached its peak intensity around 06Z on November 8th. MODIS image.
Although this may be the lowest pressure ever mapped in the Bering Sea, it is likely that the storm of October 25, 1977 was considerably stronger. An actual measured barometric pressure level (by a ship docked at Dutch Harbor on Unalaska Island in the Aleutians) of 925 mb (29.31”) during that storm would tend to indicate that, at some point, during that storm’s life cycle its central pressure was probably lower than the 925 mb figure measured and thus probably lower than the 924 mb estimate for the current storm.

A list of the top most intense extra-tropical storms (pressure-wise) to affect the northern Pacific over the past 40 years or so. Graphic from NWS-Fairbanks.
As Steve Gregory pointed out to me this morning (Saturday), the winds and significant wave heights during the 1977 cyclone were considerably more impressive than those observed (so far) from the current system. The highest significant wave heights reported by a ship or buoy in the region have been 26’ (compared to over 50’ during the 1977 storm) and the top wind speed so far measured on land has been recorded at Eareckson Air Station on Shemya Island (western Aleutians) with a gust to 97 mph and sustained at 73 mph. This is well short of the 130 mph wind gust measured at Adak Island during the 1977 storm. Of course, unlike in 1977, this storm has remained well out to sea and much further west than was the case in 1977, so the worst of its affects will probably go more or less unrecorded.
Amazingly, it was exactly on this date in 2011 that another powerful cyclone struck the Aleutian Islands (with a central pressure of 943 mb/27.85”) and prompted me to write this blog dated November 8, 2011.For those interested, I have reproduced the portion of that blog below dealing with the October 25, 1977 storm (and other past Alaskan storms). Also, for a general overview of the lowest barometric pressures ever observed on Earth (both tropical and extra-tropical), see this post.
Alaska’s Strongest Extra-tropical Storm on Record: October 25-26, 1977
The most powerful storm, at least in terms of depth of pressure, to affect Alaska in modern history was that of October 25-26, 1977. Dutch Harbor, on the Aleutian Island of Unalaska, recorded a minimum pressure of 925 mb (27.31”) on the evening of October 25th. Winds gusted to 130 mph at Adak, also in the Aleutian Islands. Adak reported a continuous 12-hour period with wind gusts of 110mph+ between 1800Z Oct. 25 and 0600Z Oct. 26. Enhanced infrared radar imagery indicated a closed ‘eye wall’ with this storm. Wave heights of 35 feet on top of swell heights of 60 feet produced significant wave heights of 72 feet according to NWS analysis and ship reports. The analysis speculated that there was the potential for waves as high as 120 feet, although nothing of this magnitude was actually observed. The cyclone had its origins, as is often the case with powerful Alaskan storms, as a West Pacific typhoon.

Hand-drawn weather maps used to be an art! Here is a view of the October 1977 storm for late evening October 25, 1977 when Alaska’s strongest storm in history deepened to 925 mb (27.31”) over Dutch Harbor on the Aleutian Island of Unalaska. Chart drawn by and supplied to me by Steve Gregory who worked with the Ocean Routes Company (now WNI) in Alaska at the time. Steve sent me this very informative email:
I worked for Oceanroutes (now WNI) when in Alaska doing site specific forecasts for 7 exploratory drilling rigs located about 6 miles offshore of Cape Yagataga along the south central coast. That location was something else. When I first started, I worked as an observer on one of the rigs (2 weeks on, 2 weeks off) and when storm systems approached, winds would increase to about 3 times what one would normally expect based on the observed pressure gradient, and winds were always out of the East, perpendicular to the isobars. No one really knew why - but we suspected it had to do with a glacier located just to our northeast. A rough rule of thumb was to use the pressure difference between Yakatut and Middleton Island - with every millibar difference equal to 5 Kts. 60Kt winds were very common - averaging 1 or 2 times /week on average. You haven't lived until you've been out on the ocean with 80mph winds and 30-foot waves.
One final comment. You will find that storms with NWS analyzed pressures of 948mb (or lower) occur quite frequently in the Gulf of Alaska. Must average at least 5 such storms every year, with 1 or 2 of them getting into the 930's. But these mega-storms attract little attention because there is no major affect on any populated areas (although aircraft landing in ANC can experience true, severe turbulence on approach through Turnagain Arm. I've never really had the time to check, but I suspect a careful analysis would show pressures in the 920's.
Other Powerful Alaskan Storms
The highest wind gust yet measured in Alaska was 159 mph at the isolated settlement of Attu on December 7, 1950. Attu is located on the westernmost Aleutian Island of the same name, some 1000 miles west of Anchorage.
The state’s highest sustained one-minute wind speed of 93 mph was recorded at Kotzebue during a storm on February 25, 1951.
In October 2004 and again in September 2005 two large storms with central pressures of 941mb produced a storm surge of almost 10.45 feet at Nome beaching boats and damaging the town’s waterfront where an unofficial wind gust of 83mph was recorded. The ferocity of both storms led then NWS Fairbanks’s Office Lead Forecaster, Rick Thoman, to comment, “Storms that affect Alaska are far, far bigger than hurricanes. Hurricanes are tiny compared to great storms that take up a quarter of the Bering Sea.” REF: Alaska Science Forum Article #1774: ‘No Hurricanes in Alaska but…’ by Ned Rozell, October 27, 2005.

A ten-foot storm surge deposited boats along the shoreline of Nome’s Snake River in September 2005. Nome’s greatest storm surge occurred during a storm in November 1974 when waters rose 13 feet above normal. Photo by Ned Rozell.
Cause of Alaskan Super Storms
The reason for the amazing intensity of some of the extra-tropical storms that swipe the Aleutians and the Bering Sea is that the low-pressure centers tap into relatively mild, moist sub-topical air off the coasts of Japan (sometimes the remnants of typhoons) and cold dry air centered over Eastern Siberia with a powerful jet stream flowing over the Bering Sea; somewhat in the same fashion that low pressure systems sometime ‘bomb out’ along the Eastern Seaboard of the United States after entraining, in their case, Gulf Stream moisture and Canadian cold, dry air.
KUDOS: Thanks to Steve Gregory (who blogs regularly for Weather Underground) and Rick Thoman (at NWS-Fairbanks) for much of the above information.
Christopher C. Burt
Weather Historian
One of the most powerful extra-tropical storms ever to pass through the Bering Sea reportedly attained a central pressure as low as 924 mb (27.29”) on Friday night/Saturday morning local time. This may rank as the lowest pressure ever ‘analyzed’ (estimated) in the Pacific Basin from an extra-tropical storm system.
The surface map for 06Z on Saturday, November 8th indicates a central pressure of 924 mb off the coast of Siberia in the Bering Sea. The lowest pressure actually measured so far is 929.8 mb at 02Z by a buoy drifting at 55.1°N, 170.7°E. Amazingly, the pressure at this buoy fell 37.3 mb (about 1.10”) in just 6 six hours between 16Z and 22Z on Friday, November 7th! Map from NWS-Anchorage.
Satellite image of the storm at 12Z on Saturday morning soon after it reached its peak intensity around 06Z on November 8th. MODIS image.
Although this may be the lowest pressure ever mapped in the Bering Sea, it is likely that the storm of October 25, 1977 was considerably stronger. An actual measured barometric pressure level (by a ship docked at Dutch Harbor on Unalaska Island in the Aleutians) of 925 mb (29.31”) during that storm would tend to indicate that, at some point, during that storm’s life cycle its central pressure was probably lower than the 925 mb figure measured and thus probably lower than the 924 mb estimate for the current storm.
A list of the top most intense extra-tropical storms (pressure-wise) to affect the northern Pacific over the past 40 years or so. Graphic from NWS-Fairbanks.
As Steve Gregory pointed out to me this morning (Saturday), the winds and significant wave heights during the 1977 cyclone were considerably more impressive than those observed (so far) from the current system. The highest significant wave heights reported by a ship or buoy in the region have been 26’ (compared to over 50’ during the 1977 storm) and the top wind speed so far measured on land has been recorded at Eareckson Air Station on Shemya Island (western Aleutians) with a gust to 97 mph and sustained at 73 mph. This is well short of the 130 mph wind gust measured at Adak Island during the 1977 storm. Of course, unlike in 1977, this storm has remained well out to sea and much further west than was the case in 1977, so the worst of its affects will probably go more or less unrecorded.
Amazingly, it was exactly on this date in 2011 that another powerful cyclone struck the Aleutian Islands (with a central pressure of 943 mb/27.85”) and prompted me to write this blog dated November 8, 2011.For those interested, I have reproduced the portion of that blog below dealing with the October 25, 1977 storm (and other past Alaskan storms). Also, for a general overview of the lowest barometric pressures ever observed on Earth (both tropical and extra-tropical), see this post.
Alaska’s Strongest Extra-tropical Storm on Record: October 25-26, 1977
The most powerful storm, at least in terms of depth of pressure, to affect Alaska in modern history was that of October 25-26, 1977. Dutch Harbor, on the Aleutian Island of Unalaska, recorded a minimum pressure of 925 mb (27.31”) on the evening of October 25th. Winds gusted to 130 mph at Adak, also in the Aleutian Islands. Adak reported a continuous 12-hour period with wind gusts of 110mph+ between 1800Z Oct. 25 and 0600Z Oct. 26. Enhanced infrared radar imagery indicated a closed ‘eye wall’ with this storm. Wave heights of 35 feet on top of swell heights of 60 feet produced significant wave heights of 72 feet according to NWS analysis and ship reports. The analysis speculated that there was the potential for waves as high as 120 feet, although nothing of this magnitude was actually observed. The cyclone had its origins, as is often the case with powerful Alaskan storms, as a West Pacific typhoon.
Hand-drawn weather maps used to be an art! Here is a view of the October 1977 storm for late evening October 25, 1977 when Alaska’s strongest storm in history deepened to 925 mb (27.31”) over Dutch Harbor on the Aleutian Island of Unalaska. Chart drawn by and supplied to me by Steve Gregory who worked with the Ocean Routes Company (now WNI) in Alaska at the time. Steve sent me this very informative email:
I worked for Oceanroutes (now WNI) when in Alaska doing site specific forecasts for 7 exploratory drilling rigs located about 6 miles offshore of Cape Yagataga along the south central coast. That location was something else. When I first started, I worked as an observer on one of the rigs (2 weeks on, 2 weeks off) and when storm systems approached, winds would increase to about 3 times what one would normally expect based on the observed pressure gradient, and winds were always out of the East, perpendicular to the isobars. No one really knew why - but we suspected it had to do with a glacier located just to our northeast. A rough rule of thumb was to use the pressure difference between Yakatut and Middleton Island - with every millibar difference equal to 5 Kts. 60Kt winds were very common - averaging 1 or 2 times /week on average. You haven't lived until you've been out on the ocean with 80mph winds and 30-foot waves.
One final comment. You will find that storms with NWS analyzed pressures of 948mb (or lower) occur quite frequently in the Gulf of Alaska. Must average at least 5 such storms every year, with 1 or 2 of them getting into the 930's. But these mega-storms attract little attention because there is no major affect on any populated areas (although aircraft landing in ANC can experience true, severe turbulence on approach through Turnagain Arm. I've never really had the time to check, but I suspect a careful analysis would show pressures in the 920's.
Other Powerful Alaskan Storms
The highest wind gust yet measured in Alaska was 159 mph at the isolated settlement of Attu on December 7, 1950. Attu is located on the westernmost Aleutian Island of the same name, some 1000 miles west of Anchorage.
The state’s highest sustained one-minute wind speed of 93 mph was recorded at Kotzebue during a storm on February 25, 1951.
In October 2004 and again in September 2005 two large storms with central pressures of 941mb produced a storm surge of almost 10.45 feet at Nome beaching boats and damaging the town’s waterfront where an unofficial wind gust of 83mph was recorded. The ferocity of both storms led then NWS Fairbanks’s Office Lead Forecaster, Rick Thoman, to comment, “Storms that affect Alaska are far, far bigger than hurricanes. Hurricanes are tiny compared to great storms that take up a quarter of the Bering Sea.” REF: Alaska Science Forum Article #1774: ‘No Hurricanes in Alaska but…’ by Ned Rozell, October 27, 2005.
A ten-foot storm surge deposited boats along the shoreline of Nome’s Snake River in September 2005. Nome’s greatest storm surge occurred during a storm in November 1974 when waters rose 13 feet above normal. Photo by Ned Rozell.
Cause of Alaskan Super Storms
The reason for the amazing intensity of some of the extra-tropical storms that swipe the Aleutians and the Bering Sea is that the low-pressure centers tap into relatively mild, moist sub-topical air off the coasts of Japan (sometimes the remnants of typhoons) and cold dry air centered over Eastern Siberia with a powerful jet stream flowing over the Bering Sea; somewhat in the same fashion that low pressure systems sometime ‘bomb out’ along the Eastern Seaboard of the United States after entraining, in their case, Gulf Stream moisture and Canadian cold, dry air.
KUDOS: Thanks to Steve Gregory (who blogs regularly for Weather Underground) and Rick Thoman (at NWS-Fairbanks) for much of the above information.
Christopher C. Burt
Weather Historian
Update on Change to Winter Weather
Riverton Forecast Office has provided an update video on the dramatic change to winter over the cowboy state this week.
Upcoming Winter Weather Update Video
Upcoming Winter Weather Update Video
Saturday, November 8, 2014
Winter Finally Heading For Wyoming!
A major change in the weather pattern is about to take place. Riverton WFO has provided a comprehensive discussion of what can be expected this next week. It appears now that the primary effect will occur initially east of the Continental Divide but all of the Cowboy State will see a major change beginning by Monday.
Old Man Winter arrives late this weekend and he will decide to stay a while this time. After a warm and at times, breezy weekend, expect a sharp change to cold and wintry conditions Sunday night into Monday morning. Widespread accumulating snow, well below normal temperatures, and gusty north wind will accompany an arcitc push east of the Divide on Monday, with a re-enforcing shot of cold air arriving on Tuesday into Wednesday. Temperatures will begin to rebound a bit on Thursday with another system possibly bringing rain and snow showers to the I-80 corridor. A little less impact is expected west of the Divide and across the south as the brunt of the storm remains east; only isolated snow showers and cooler temperatures are expected there.
Old Man Winter arrives late this weekend and he will decide to stay a while this time. After a warm and at times, breezy weekend, expect a sharp change to cold and wintry conditions Sunday night into Monday morning. Widespread accumulating snow, well below normal temperatures, and gusty north wind will accompany an arcitc push east of the Divide on Monday, with a re-enforcing shot of cold air arriving on Tuesday into Wednesday. Temperatures will begin to rebound a bit on Thursday with another system possibly bringing rain and snow showers to the I-80 corridor. A little less impact is expected west of the Divide and across the south as the brunt of the storm remains east; only isolated snow showers and cooler temperatures are expected there.
Hunters and others who expect to be outdoors late this weekend into Veterans' Day should prepare for a significant shift to cold, wet, and windy conditions.
 |
Click Image To Enlarge
|

Stay up to date with our current products, and what they mean as they will be updated throughout the weekend:
|
| Freeze Watch / Warning |
 |  |
| Click Loop To Enlarge
Model Depiction of Temperature at 10k feet.
Green and orange shades show more mild air, the white line is the freezing line, and anything in the blue to purple shades is cold...the icy blue to navy blue shades are very cold for this time of year, and the tan shades inside of the navy blue shades show near record breaking cold temperatures!
The loop advances in 6 hour time steps, beginning at 5am Friday morning and ending next Friday afternoon. The time stamp in the bottom right hand corner shows the valid time in "Z Time" (where 00Z = 5pm and 12Z = 5am MST) | Click Image To Enlarge Storm Impacts
The main storm impact is expected to be a result of the very cold temperatures that will be moving in; after such a long and mild fall, this sudden and severe temperature drop will be a shock to the system. Those who plan to be outdoors for Veteran's Day should plan for very cold temperatures, wet conditions, and gusty winds; especially Hunters.
Roads in the low elevations will be on the warm side at the beginning of the storm, this could limit snow accumulation at first on Monday but it will eventually cool enough to allow some accumulation as well as result in some icy spots, especially Monday Night and Tuesday. |
 |
| Click Image To Enlarge
Storm total snow forecast through Monday Afternoon (issued Friday Morning)
|
 |  |
| Click Image To Enlarge 12 Hour Snow Accumulation Forecast | Click Image To Enlarge 12 Hour Peak Wind Gusts |
 |  |
| Click Image To Enlarge 24 Hour Snow Accumulation Forecast | Click Image To Enlarge 24 Hour Peak Wind Gusts |
 | |
| Click Image To Enlarge 36 Hour Snow Accumulation Forecast | Click Image To Enlarge 36 Hour Peak Wind Gusts |
Temperature Change Sunday (11/9) Versus Wednesday (11/12)
 |  |
| Click Image To Enlarge Sunday's High Temperature | Click Image To Enlarge Wednesday's High Temperature |

Also of interest for those who are traveling: there is a tool available on this websitethat gives you the expected weather conditions along your customized route(instructions here). This web page also displays an array of data that comes out of our office in a very attractive and easy to understand format. Give it a try. In addition, you may also want to check out the web cameras along your route using our handy web cam mosaic page.
|
|


 |  |  |  |
 |  |  |  |
 |  |  |  |
PLEASE SEND US YOUR SNOW REPORTS (CLICK HERE)
 | Monitor our Severe Weather Summary Page for current Warnings, Watches, and Advisories.What's the difference? |
 | Check the latest Weather Story graphic for an overview of the area forecast. |
 | Check out what's on the radar. Riverton | Pocatello | Cheyenne | Billings | Salt Lake City | Rapid City | Mosaic |
 | Submit storm reports/images and keep up to date with us on Facebook! |
 | Submit storm reports/images and keep up to date with us on Twitter! |
 | Other reporting methods include eSpotter, email (cr.wxriw@noaa.gov), or by phone at 1-800-211-1448. |
 | Check the latest Public Information Statement for the latest storm reports. |
 | Monitor current road conditions by visiting the Wyoming Dept. of Transportation (WYDOT) or by calling 5-1-1. |


Thursday, November 6, 2014
Weekend Weather Video-WInter Coming East of Divide
The Weekly Weather Video From Riverton Forecast Office highlights the big change by Monday, mainly east of Continental Divide
Weekly Weather Briefing
Weekly Weather Briefing
Subscribe to:
Posts (Atom)