Monday, November 5, 2012

Winter Weather On The Way for Wyoming

Mild late Fall weather will continue through mid-week across Star Valley and the surrounding areas.  However all the models now agree that a major change is coming.  A strong cold front will move across western Wyoming by Thursday night ushering in the coldest temperatures since early last March.

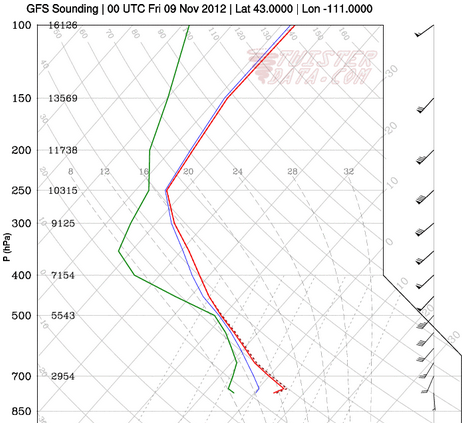
While snow is expected with and behind the cold front across the area, it is the dramatic temperature change that will have the greatest impact. Forecast model soundings for Thursday, Friday and Saturday evening over Star Valley provide a visual display of the arrival of cold air.

Thursday Evening
 
Friday Evening

Saturday Evening

The potential for significant snow will decrease on Saturday as colder and drier air spreads across Star Valley.  Several inches of snow are possible in the valley by Saturday morning with greater amounts in the higher mountains, particularly the Tetons.  At this time it does not appear to be a particularly wet storm system, but mountains could receive upwards of a foot by late Saturday.

Riverton WFO has provided a good summary of the big changes:
http://www.crh.noaa.gov/riw/?n=weatherbriefing

Star Valley temperatures will struggle to reach freezing  Saturday with the potential for near zero readings in coldest locations by Sunday morning provided skies clear sufficiently.


Sunday, November 4, 2012

New Capabilities of the Weather Camera link

 The initial post on this blog was a description of the Weather Camera link on the site.  This was posted on 10/11/11.  John has since improved the site archiving capability and thus a re-posting  of the original description with the added info about the improvements follows.  The additional discussion is underlined at the end.


The Weather Camera is a link to the site www.halescamvideo.com that was developed by John Hales as a Christmas Gift to me(his father) in 2008.  While John provides any technical needs, I am the site manager and maintain quality control of the Cams on the site.

At any given time there could be as many as 130 web cams displayed.  The criteria used to determine the display of a camera are:

1. Quality of the image.(StarDot Cameras much preferred).

2. Frequency of updates. (ideally every minute)

3. Proximity to Star Valley WY

4. View of the sky.

5. Reliability

Current Features

Left click on the image will provide a  larger current image

The cursor at the top of each cam will open up the control menu for that particular cam.


Left click on the minutes option(30 60 120 180 300) will build a loop of that length in time.

Left click on the info (i) button and it will bring up a google map centered on the webcam location.  Additionally it will display the latest weather observation and identifying the location of the observation.

There is also a radar option which when turned on will display the current composite reflectivity product from the NWS 

Clicking on the + will open up a looping option.  At least 3 days are available in the archive for all cams.  Selecting the date/time and looping length in minutes will rebuild a loop.

There are two options when building a loop.  The Load Loop option will rebuild a requested  time period  and display it.  A much more powerful option is the Create Video.  This will build the requested time period and then display the Download mp4 Video which will then produce a url  that can be copied/sent or saved as a video file.

As an example using this command a video was made of the Star Valley Ranch snow gauge on March 2 2012 when the snow depth was at its deepest point during the past winter.  This video was created on November 3 2012 as the number of archived days for this particular cam extended back that far.

 http://www.camviewing.com/clips/SVH1_2012-11-03-2256MST_300.mp4

While all cams have at least the most recent 3 days archived, additional days can be added to a particular cam upon request.


Thursday, November 1, 2012

Hurricane Sandy

One of the most damaging and costliest weather events in United States history  occurred along the east coast on October 28-30 2012.  There are already many experts pontificating on where this storm stands in historic terms and what can be implied by its occurrence with regards to the future of the planet.

However,  for me, the piece in the Wall Street Journal on Nov. 1 from Dr. Roger Pielke Jr. provided the most reasonable assessment of Sandy.  Following is the article, with my highlights of the  important points he brings out.


Roger Pielke: Hurricanes and Human Choice


Hurricane Sandy left in its path some impressive statistics. Its central pressure was the lowest ever recorded for a storm north of North Carolina, breaking a record set by the devastating "Long Island Express" hurricane of 1938. Along the East Coast, Sandy led to more than 50 deaths, left millions without power and caused an estimated $20 billion or more in damage.

But to call Sandy a harbinger of a "new normal," in which unprecedented weather events cause unprecedented destruction, would be wrong. This historic storm should remind us that planet Earth is a dangerous place, where extreme events are commonplace and disasters are to be expected. In the proper context, Sandy is less an example of how bad things can get than a reminder that they could be much worse.

In studying hurricanes, we can make rough comparisons over time by adjusting past losses to account for inflation and the growth of coastal communities. If Sandy causes $20 billion in damage (in 2012 dollars), it would rank as the 17th most damaging hurricane or tropical storm (out of 242) to hit the U.S. since 1900—a significant event, but not close to the top 10. The Great Miami Hurricane of 1926 tops the list (according to estimates by the catastrophe-insurance provider ICAT), as it would cause $180 billion in damage if it were to strike today. Hurricane Katrina ranks fourth at $85 billion.image

A worker pushes water toward a storm drain on Wall Street as the city tries to recover from the effects of Hurricane Sandy in New York on Wednesday.

To put things into even starker perspective, consider that from August 1954 through August 1955, the East Coast saw three different storms make landfall—Carol, Hazel and Diane—that in 2012 each would have caused about twice as much damage as Sandy.

While it's hardly mentioned in the media, the U.S. is currently in an extended and intense hurricane "drought." The last Category 3 or stronger storm to make landfall was Wilma in 2005. The more than seven years since then is the longest such span in over a century.

Flood damage has decreased as a proportion of the economy since reliable records were first kept by the National Weather Service in the 1930s, and there is no evidence of increasing extreme river floods. Historic tornado damage (adjusted for changing levels of development) has decreased since 1950, paralleling a dramatic reduction in casualties. Although the tragic impacts of tornadoes in 2011 (including 553 confirmed deaths) were comparable only to those of 1953 and 1964, such tornado impacts were far more common in the first half of the 20th century.

The United Nations Intergovernmental Panel on Climate Change reports that drought in America's central plains has decreased in recent decades. And even when extensive drought occurs, we fare better. For example, the widespread 2012 drought was about 10% as costly to the U.S. economy as the multiyear 1988-89 drought, indicating greater resiliency of American agriculture.

There is therefore reason to believe we are living in an extended period of relatively good fortune with respect to disasters. A recurrence of the 1906 San Francisco earthquake today, for example, could cause more than $300 billion in damage and thousands of lives, according to a study I co-published in 2009.

So how can today's disasters, even if less physically powerful than previous ones, have such staggering financial costs? One reason: There are more people and more wealth in harm's way. Partly this is due to local land-use policies, partly to incentives such as government-subsidized insurance, but mostly to the simple fact that people like being on the coast and near rivers.

Even so, with respect to disasters we really do make our own luck. The relatively low number of casualties caused by Sandy is a testament to the success story that is the U.S. National Weather Service and parallel efforts of those who emphasize preparedness and emergency response in the public and private sectors. Everyone in the disaster-management community deserves thanks; the mitigation of the impacts from natural disasters has been a true national success story of the past century.

But continued success isn't guaranteed. The bungled response and tragic consequences associated with Hurricane Katrina tell us what can happen when we let our guard down.

And there are indications that we are setting the stage for making future disasters worse. For instance, a U.S. polar-satellite program crucial to weather forecasting has been described by the administrator of the federal agency that oversees it—the National Oceanic and Atmospheric Administration—as a "dysfunctional program that had become a national embarrassment due to chronic management problems." The lack of effective presidential and congressional oversight of this program over more than a decade can be blamed on both Republicans and Democrats. The program's mishandling may mean a gap in satellite coverage and a possible degradation in forecasts.

Another danger: Public discussion of disasters risks being taken over by the climate lobby and its allies, who exploit every extreme event to argue for action on energy policy. In New York this week, Gov. Andrew Cuomo declared: "I think at this point it is undeniable but that we have a higher frequency of these extreme weather situations and we're going to have to deal with it." New York Mayor Michael Bloomberg spoke similarly.

Humans do affect the climate system, and it is indeed important to take action on energy policy—but to connect energy policy and disasters makes little scientific or policy sense. There are no signs that human-caused climate change has increased the toll of recent disasters, as even the most recent extreme-event report of the Intergovernmental Panel on Climate Change finds. And even under the assumptions of the IPCC, changes to energy policies wouldn't have a discernible impact on future disasters for the better part of a century or more.

The only strategies that will help us effectively prepare for future disasters are those that have succeeded in the past: strategic land use, structural protection, and effective forecasts, warnings and evacuations. That is the real lesson of Sandy. 

Mr. Pielke is a professor of environmental studies and a fellow of the Cooperative Institute for Research in Environmental Sciences at the University of Colorado.
Tuesday, October 23, 2012

Snow Facts

Snow has diminished to flurries this Tuesday evening in the wake of the Fall's first storm in Western Wyoming.  Here is a list of reported snow totals Monday night and Tuesday courtesy of Riverton Forecast Office.

October 22-23 2012 Snowfall Totals
County Station Name Snowfall
Fremont Hobbs Park Snotel 16
Fremont Cold Springs Snotel 13
Fremont Little Warm Snotel 10
Fremont Deer Park Snotel 7
Fremont Brooks Lake Lodge 7
Fremont Burroughs Creek Snotel 5
Fremont South Pass Snotel 4
Fremont St. Lawrence Alt Snotel 3
Fremont Castle Creek Snotel 3
Fremont Townsend Creek Snotel 2
Fremont Dubois 2
Hot Springs Owl Creek Snotel 2
Lincoln 1 SW Kemmerer 9
Lincoln Commissary Ridge (9330 FT) 9
Lincoln 10 W Kemmerer 8
Lincoln Indian Creek Snotel 8
Lincoln Spring Creek Divide Snotel 7
Lincoln Willow Creek Snotel 7
Lincoln Kemmerer 6
Lincoln 21 NNW Kemmerer 5.5
Lincoln Kelley Ranger Station Snotel 5
Lincoln Afton 4.8
Lincoln 5 NNE Thayne/Star Valley Ranch 4.5
Lincoln Blind Bull Summit Snotel 4
Lincoln Blind Bull Summit 4
Lincoln Turnerville 4
Lincoln 5 SSE Smoot 4
Lincoln Cottonwood Creek Snotel 3
Lincoln Hams Fork Snotel 3
Lincoln 1 N Kemmerer 3
Lincoln Salt River Summit Snotel 2
Lincoln 3 SE Bedford 1
Park Kirwin Snotel 11
Park Blackwater Snotel 9
Park Younts Peak Snotel 4
Park Beartooth Lake Snotel 4
Park Evening Star Snotel 3
Park Timber Creek Snotel 2
Park Marquette Snotel 2
Sublette Pocket Creek Snotel 11
Sublette Big Sandy Opening Snotel 8
Sublette Gunsite Pass Snotel 8
Sublette Larsen Creek Snotel 6
Sublette Triple Peak Snotel 4
Sublette Elkhart Park G.S. Snotel 4
Sublette Snider Basin Snotel 2
Sublette Boulder Rearing Station 2
Sublette 14 NW Pinedale 1.1
Sublette Kendall Ranger Station Snotel 1
Sublette Loomis Park Snotel 1
Sublette 9 N Daniel 0.5
Sweetwater 5 N Farson 2
Teton Jackson Hole-Rendezvous Bowl 10
Teton Grand Targhee Snotel 8
Teton Grand Targhee-Chief Joseph 8
Teton Jackson Hole-Raymer 8
Teton Togwotee Pass Snotel 7
Teton Togwotee Mountain Lodge 6
Teton Phillips Bench Snotel 6
Teton Jackson Hole-Mid 5
Teton Gros Ventre Summit Snotel 2
Teton Grassy Lake Snotel 1
Teton Snow King Ski Area 1
Yellowstone Two Ocean Plateau Snotel 10
Yellowstone Parker Peak Snotel 5
Yellowstone Sylvan Lake Snotel 4
Yellowstone Lewis Lake Divide Snotel 4
Yellowstone Sylvan Road Snotel 3
Yellowstone Snake River Ranger Station 2
Yellowstone Thumb Divide Snotel 2
Yellowstone Yellowstone East Entrance 1
Yellowstone Canyon Snotel 1


 Tuesday evenings upper air analysis and satellite photo indicate the cold upper low/trough is still to the west of Wyoming

Over the next couple days the forecast models are moving the trough and associated unsettled weather east across the Northwestern U.S..  This will maintain periods of snow showers over much of Western Wyoming which could produce several more inches of snow.  The forecast precipitation for the period Tuesday evening through Friday shows much of the heavier amounts will be near the higher terrain


By Thursday evening the trough is shifting eastward  into the Central States with a lessening of snow chances toward the weekend across Western Wyoming.


Sunday, October 21, 2012

Stormy Week Ahead

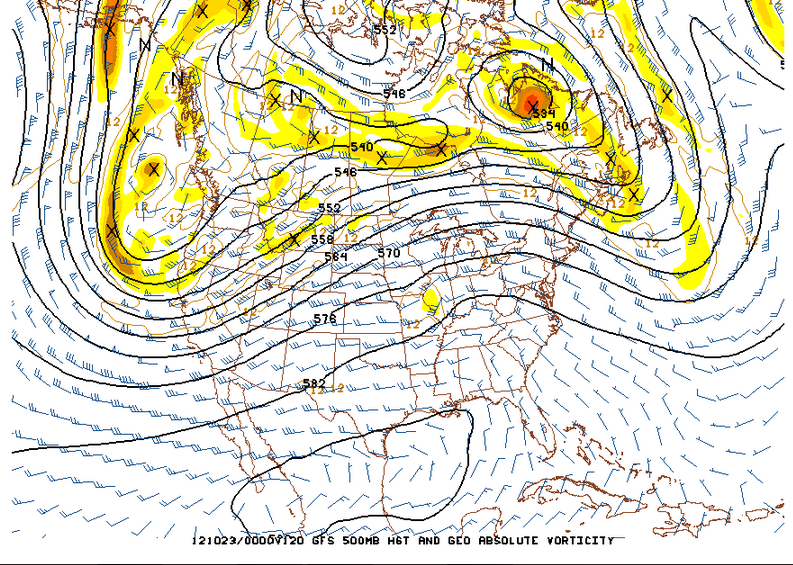
The big pattern change that has been advertised for the last several days is occurring this weekend.  A large cold trough moving onto the west coast will dominate the western states through much of the week.

The first chart is the 500mb analysis Sunday morning followed by the forecast 500mb chart for Wednesday morning.


Local mountains will see significant snow this week, possibly totaling 1-2 feet. In Star Valley precipitation should turn to all snow by Tuesday.  Temperatures will remain in the 30s in the valley during the daytime hours from Tuesday on, so at least some accumulation is likely, particularly in the higher locations.

The Riverton Forecast Office has issued a comprehensive discussion on the upcoming weeks weather.

http://www.crh.noaa.gov/news/display_cmsstory.php?wfo=riw&storyid=88551&source=0

Thursday, October 18, 2012

SNOW ON THE WAY

The first significant fall precipitation event across Star Valley occurred on Tuesday. It provided  amounts ranging from 1/4 to over 1/2 inch.  Here are some observed totals.

2 NW of Etna       .80
Afton                   .58
Smoot                  .49
Thayne ES           .36
Alpine                  .32
Etna ES                .30
Star Valley Ranch  .22

Below is a precipitation map covering the surrounding regions from the recent storm


Over an inch occurred in the mountains north of Star Valley, particularly the Tetons.

For much of the event the snow level was above about 8500 feet.

A cam photo taken Wednesday afternoon shows the fresh snow on the Tetons.


The computer models have been quite erratic in forecasting what now appears to be a major pattern change coming this weekend.  However the Wednesday evening model solutions are generally agreeing that the large upper ridge now over the western states will be replaced be a strong and cold upper low pressure trough forming this weekend off the West Coast and then slowly moving eastward toward Star Valley next week.

Here is the 500 mb chart observed this Wednesday evening showing the deep low over the Central states and high pressure along the West Coast.


500MB Analysis Wednesday evening 10/17/12
Following are the forecasted 500MB charts for both this Saturday evening and Monday evening.

 The deep central states trough moves east with the upper ridge currently near the West Coast shifting all the way east to the eastern states by Monday.  The deepening trough of low pressure develops near the West Coast this coming weekend will provide an intensifying southwesterly jet across Wyoming.  This pattern would favor initially precipitation developing by Sunday over Star Valley which should mostly be rain in the lower elevations but possibly significant snow in the Salt and Wyoming ranges.

However, possibly as early as Monday morning, colder air will likely lower the snow level to the valley floor.  Additional periods of precipitation will likely occur well into next week with snow likely in the valley.

The following are the 24 hour forecasted precipitation  amounts for Sunday and Monday.

Sunday forecasted precipitation

5 day total forecasted precipitation through Monday evening
 It is still too early to be specific as to when/where and how much snow will fall in the valley; it appears that potentially 1-2 feet could occur in the higher mountains beginning Sunday into early next week.

Since a big pattern change is imminent, it is instructive to put into perspective the difficulty that the current computer models have in forecasting this type of change.  An excellent blog was posted this morning on this very subject and if interested can be seen here.

http://wasatchweatherweenies.blogspot.com/2012/10/rolling-dice-with-ensembles.html


Friday, October 12, 2012

Columbus Day Blow Down

Friday, October 12th marked the 50 anniversary of the Historic Columbus Day Wind Storm in the Pacific Northwest.  This was the most damaging  storm to hit the West Coast in the 20th century. An excellent presentations has been prepared  on the storm at the following forecast office.

Portland Oregon WFO

http://prezi.com/lrr7bpc9coz3/columbus-day-storm-october-12-1962/