Tuesday, May 15, 2012

Wyoming Precipitation

Since the most recent Snowfall season has about ended(as anyone who lives in Wyoming knows the only months you can count on it not snowing are July and August) it is of interest to look at some of the excellent precipitation graphics that are available through the National Weather Service.

For an overview the first image is one of the normal annual precipitation that occurs over the 48 states.

"Normal" precipitation is derived from PRISM climate data, created at Oregon State University. The PRISM gridded climate maps are considered the most detailed, highest-quality spatial climate data sets currently available. The 30 year PRISM normal from 1971-2000 is used for precipitation analysis since 2004. Prior to 2004 the 30 year PRISM normal from 1961-1990 is used.


Once east of the Rockies the amount of precipitation that falls generally increases the further east and south toward the Gulf of Mexico and Atlantic Ocean. Over the Western states, it is quickly obvious the major role that the mountains play.  The greatest amounts fall generally over and west of the Cascades and Sierras Nevada Mountains.  In some place over 100 inches of precipitation is the normal amount!

Zooming in on the State of Wyoming and examining the precipitation distribution  it is easily seen the tremendous role the terrain plays.


The major mountain ranges of western Wyoming coincides with the greatest precipitation amounts. The Tetons normally experience upwards to 70 inches with the Salt Range40- 50 inches.  Amounts in Star Valley are around 20 inches.

The east side of the Western Wyoming mountain ranges generally receive less than 10 inches in a typical year.

The Water Year 2011 which extended from Oct 2010 to Oct 2011 was very wet across much of Wyoming as show in this image


Amounts ranged upwards to near 100 inches in the Tetons with much of Star Valley in excess of 25 inches.  All of western Wyoming was well above normal, except for the normally dry east side of the mountains where generally as little as 5 inches fell.

While the current water year has another 4 months to go, it can be seen that it has been  a much drier period.

It has been particularly dry on the east side of the mountains with only a couple inches having fallen since October 2011.  Typically the summer months do not provide much useful precipitation for purposes of water supply, so it is fortunate that most of the states reservoirs are still flush with the previous winters bountiful runoff.

Monday, May 7, 2012

Best Time to Plant Vegetable Seeds in Star Valley


The second week in May will see Star Valley warming to above normal daytime temperatures with 60s and possibly low 70s under mostly sunny skies. There were even warmer periods in April when near record temperatures occurred.

Thayne Elementary Maximum Temperatures April 7-May 7 2012

Given the unusually warm start to Spring the question is when  would be the favorable time to plant seeds for the summer gardens.  It is instructive to first look at the table  below that shows the soil temperatures(about 4 inches deep) when germination is most likely.


With the Thayne Elementary weather station having three soil temperature sensors( near the surface, 2 feet and 4 feet), it is interesting to compare how the soil is warming up at different levels coupled with the air temperature.

This first graph shows the 2 foot deep sensor over the last 6 plus months.

Two foot soil temperature Oct 1 2011 to May 7 2012

The temperature held around freezing from the first of January until the end of March when the snow cover melted.

For the past month even though April experienced unusually warm conditions, the soil temperature warmed only gradually.

Maximum air temperature and 2 foot soil temperature April 7-May 7 2012


Referring to the above table for seed germination, even though it was a warm April, only a very few seeds would germinate at 40F. The study was done for a 4 inch level, however both the 2 and 4 foot level temperatures were similar

Yellow  4 foot and red 2 foot soil temperatures April 6-May 7 2012


The first soil sensor just below the surface has large diurnal ranges

Sub-surface soil sensor April 6-May 7 2012


Thus at a 4 inch depth per the table the Thayne temperature at 4 inches is likely slightly warmer than the 2 and 4 foot levels.

There are several vegetable seeds that are not adaptable to the not only short growing season in Star Valley but also as can be seen from the observed 2 foot sensor temperatures from late last summer, which did not exceed 60F,  remains too cool.

Two foot soil  temperature August 15-September 15 2011

The soil temperatures can be accessed on line at any time at the Thayne Elementary weather station using this link

http://www.weatherlink.com/user/thayne/index.php?view=summary&headers=1


Saturday, May 5, 2012

Brief Return to Winter Scene

Star Valley woke up Saturday morning to a somewhat surprise. A cold front crossed through the valley around 3am followed by a couple hours of wet snow.  By mid morning skies were clearing after up to 2 inches of snow fell at Star Valley Ranch and a lessor amount at lower elevations.  By mid afternoon the morning winter scene will already be a memory as the strong May sun should make short work of the snow.  Here are some pictures taken this morning at Star Valley Ranch before the melting began.


High Pressure takes control and after a general freeze across the valley Sunday morning, several days of beautiful Spring weather are ahead as afternoon temperatures return to the 60s.

Sunday, April 29, 2012

Etna Elementary Weather Station

The Davis Weather Station located on top of Etna Elementary started observing on October 12,2010 and has the longest uninterrupted record of the three new stations in the Lower Star Valley.  The data collected from the Etna station includes temperature, humidity, precipitation,  wind direction and speed  along with the barometric pressure.

The purpose of this post is to review the conditions that have occurred since the station  was established, with emphasis on the most recent 12 months.

The first graph will show the maximum and minimum temperatures for the first 12 months of the station beginning October 2010


This next graph displays the maximum and minimum temperatures for the most recent 12 month period  through the end of April 2012


Relative humidity, which is a function of both the temperature and the moisture(dew point), remains  consistently higher throughout the colder months.

 The weather station also measures both the indoor temperature and humidity at the location of the  station console.  In the case of Etna  this is in the administration office.  As would be expected, the temperatures year around remain at a  comfortable level.  However, in the winter months the actual water vapor in the air is quite low, even though the outside relative humidity is typically high.

This results in very low indoor humidity in the cold months. Comparing inside/outside relative humidity dramatically illustrates this.


It is very interesting to look at a cold week beginning January 9, 2012.


The red line represents the outside temperature with the orange representing the inside temperature. Note the indoor  relative humidity represented by the yellow line on the graph.  While the indoor temperature remains  around 80F the entire week, the indoor relative humidity rises/falls in concert with the outside temperature.  For the entire week the indoor humidity rises no higher than 10 percent, while on the coldest day it drops to as low as nearly 0 percent!  This provides an environment drier than the desert in the heat of the summer!

This is likely typical of any heated building or home in the winter months in Star Valley. One can conclude that it would be of importance to provide an artificial source of moisture via humidifiers to improve the  indoor environment.

 The Etna Rain Gauge has a heater installed, melting the snow that is caught.  The problem during the Winter since the gauge is on the roof of the school the wind that typically accompanies the snow reduces the amount that is actually caught and measured.  Thus the most reliable measurements would occur in the warmer months when precipitation is liquid. The bar graph below shows the monthly precipitation caught:


The weather station also computes the wind run:


Wind run is a meteorological term used to categorize or determine the total distance (or amount) of the traveled wind over a period of time. The readings are collected using an anemometer.
Wind run can help to determine the rate of evaporation of moisture over a particular area.

From the data Spring seems to be the windiest period with the least this past December.  The winter low in wind run is reasonable given the amount of time the valley is under an inversion, when winds typically are very light.

The weather station also keeps track of the highest daily wind gust

In the past 12 months there were two times when the wind gusted above 50 mph. During the cold of December when inversions dominated, winds typically were under 10 mph.

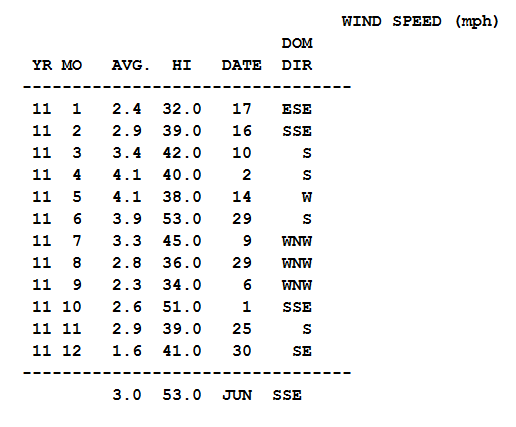
The software associated with the weather station also provides annual summary charts.

These are the charts for 2011, the first full year of the Etna School Station


Thursday, April 26, 2012

Return to More Typical Late April Weather

A cold front will cross Western Wyoming this Thursday evening bringing an end to the unusual string of warm days for Star Valley.  The strong cold upper trough moving eastward with the front is responsible for the change.
500 mb Analysis with radar at 5pm Wednesday 4/26/2012

Along with the 500mb analysis is the corresponding radar image showing the more widespread precipitation along with cold front.  While scattered  showers and thundershowers have occurred across Star Valley Thursday afternoon, when the front passes more general showers will occur with a rapidly lowering snow level.  Very gusty winds have been reported with the Star Valley Ranch observation hitting 56 mph at 1:45pm with a passing thundershower.

By morning the snow level will have lowered to the valley floor but any significant accumulation should be confined to the higher elevations with several inches possible above 7500 feet.

The Riverton WFO has provided a short video discussion  covering the expected weather for Western Wyoming through the first of next week.  It can be viewed here.

http://www.crh.noaa.gov/riw/?n=weatherbriefing

Monday, April 23, 2012

A Day for the Weather Record Book

It is hard to believe that there is still a week left in April, as the weather is behaving more like June or July.  Not only are temperatures running near/above record level,  high based afternoon thunderstorms are developing in response to the heating.

Here is the Monday evening 500mb chart showing the huge upper ridge over the west and deep, cold trough across the eastern states.

To provide some perspective as to the how warm the temperatures are, the record high  for the month of April at the Bedford climate station going back to 1975 is 75 degrees.  While at the Afton COOP station the highest for the month of April going back to 1957 is 78 degrees.

Following are maximums recorded across Star Valley on Monday

Etna Elementary         82

Thayne Elementary     82

Star Valley Ranch        79
   
Alpine                          81     

 Smoot                         75

Auburn                         80


Afton                            77

The statement issued by the WFO at Pocatello Monday evening  is of interest:
 
RECORD EVENT REPORT 
 NATIONAL WEATHER SERVICE POCATELLO ID
 715 PM MDT MON APR 23 2012
 
 ...RECORD HIGH TEMPERATURES SET FOR THE MONTH OF APRIL...
 
  IDAHO FALLS AND POCATELLO BOTH ESTABLISHED HIGH TEMPERATURE RECORDS 
 FOR THE MONTH OF APRIL TODAY.
 
  IDAHO FALLS RECORDED 86 DEGREES TODAY WHICH IS THE ALL TIME APRIL 
 HIGH BREAKING THE PREVIOUS RECORD OF 85 SET ON THE 29TH OF APRIL IN 
 1992. 
 
  86 DEGREES IN POCATELLO TIED THREE PREVIOUS RECORDS OF 86 SET ON 
 THE 21ST IN 1994...29TH IN 1992...AND 25TH IN 1946. 
 
 
There is at least one more day of similar weather as the upper high pressure 
remains in place through Tuesday.  However changes will begin Wednesday with not 
only cooler temperatures but an increase chance of thunderstorms. 
 
By the weekend a trough of low pressure will reside over Wyoming returning Star Valley
to more typical late April conditions. 
 
500 mb forecast Mid Day Sunday  April 29 2012
 

Thursday, April 19, 2012

Thayne Elementary Weather Station

A Davis Weather Station was installed  at Thayne Elementary School in September 2010 and has been transmitting data since 3pm  September 22, 2010.  There has been only one interruption of data from the station which occurred from September 28,2011 until October 25, 2011.  On August 15, 2011 the sensors for both soil temperature and moisture were added to the station.

Here are some interesting graphs of some of the data thus far from the station.  Though not able to grab more than a year at a time, this first image is the daily maximum and minimum temperature for the first 12 months:


Thayne Elementary max and min temps from September 2010 to August 2011
and the most recent twelve months:

Thayne Elementary max and min temps from May 2011 to April 2012

For the short history of the station, the highest observed temperature was 94F on August 26, 2011.  The coldest occurred on February 2, 2011 when -30F was observed.  The coldest this past winter also occurred in 2011 when  -15F was hit on December 23rd.

The winter of 2010-2011 saw the temperature dip below zero on 28 days  This past winter there were 40 days  below zero.  December 2011 was particularly cold when 20 days dipped below zero.

In 2011, the first full summer of observations, there were only 6 days when the temperature exceeded 90F.

The highest wind gust thus far observed was 54 mph at 6pm, June 29,2011.

It is interesting to look at the data which has been collected with the soil moisture and temperature sensors since they were installed last August.

The first temperature sensor is located just below the surface on the school  grounds with the  2nd sensor buried at a depth of one foot and the third at 2 feet.

When looking at the sensor located just below the surface, it is surprising to see the large range of temperatures on particularly sunny days.

Near surface Thayne Elementary  temperature
There were a couple days around 100F last September and even above 80F already this spring.

However the 1 foot and 2 foot sensors tell a much different story with both dropping to freezing early in January and remaining there until the last week in March.

Thayne Soil Temperature at a depth of one foot


Thayne Soil Temperature at a depth of two feet.
The moisture sensor thus far indicates fairly high soil moisture content

Thayne 1 foot soil moisture content in centibars
The current reading of 10 centibars is a very moist soil.  It will be interesting to see how this sensor responds during summer  It can be observed any time on line at
 http://www.weatherlink.com/user/thayne/index.php?view=summary&headers=1

For additional information (as to what this measurement suggests) the following  is helpful:

General rule of thumb for interpretation:
Soil moisture is nearing a critically dry level when soil tension (indicated by the centibar meter reading) reaches a level that corresponds to more than 50 percent depletion of the plant available water at a specific soil depth.  The critical soil  tension level that corresponds with 50 percent depletion levels will vary depending upon soil type because of different soil porosity characteristics..   For example, a soil  tension reading of 35 centibars may indicate that a very sandy soil will approach 50 percent depletion of plant available soil moisture but for a loam/silt loam soil 50 percent depletion may  not be approached until tension readings approach 110 to 130 centibars.