Tuesday, June 28, 2016

Who Provides the Most Accurate Weather Forecasts?

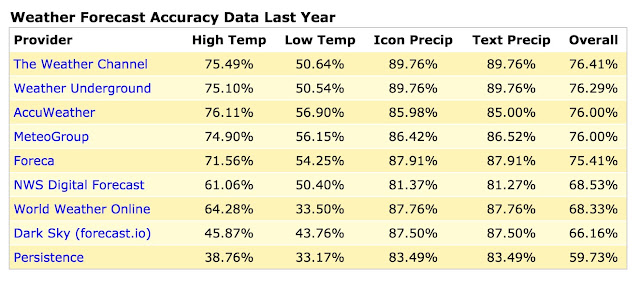
Cliff Mass of the University of Washington posted a very interesting blog on who provides the most accurate weather forecasts. While the results are for locations in the state of Washington, they likely reflect other areas as well.  It does appear private forecasts such as from The Weather Channel and AccuWeather are as good or better than the National Weather Service in providing information on daily temperatures and chances of precipitation. When it comes to forecasting severe storms it is noted that the Storm Prediction Center is world-class.

Who provides the best weather forecasts?

One question I frequently get is: where can I get the best weather forecasts?   Quality varies substantially and the answer is often different between garden variety forecasts and more difficult rare/severe weather events.

So what about garden-variety weather predictions?  What source is best?  The National Weather Service, Weather.com or Accuweather?  Or what?

There is a web site, forecastadvisor.com, that provides average verification statistics for the last month or year for a large number of locations.  Our independent verification for some Northwest locations suggests that this site is relatively reliable.  

Here is the table for Seattle for the last year.  For temperature, they consider a forecast accurate if it is within 3F.    Precipitation is not so clear, since they consider the forecast as rain if there is any chance of precipitation in the forecast.   So you might dismiss the precipitation evaluation...although all forecasts are verified in the same way.

Considering temperature, the three best are the Weather Channel, the Weather Underground, and Accuweather--I doubt whether the differences are statistically significant.   The Weather Service is a step down.


What about Spokane?  The same three are on top, but this time Accuweather is the leader, particularly for low temperatures.  They are good at low temperatures.  Again, the NWS lags a bit.


Finally, lets look at Yakima, the primary agricultural center of our state.  Same three in the lead, and Accuweather is again better at the low temperatures.

So why do the Weather Channel, Weatther Underground and Accuweather produce better forecasts than the National Weather Service on average?    The key reason is that they generally make use of multiple  weather forecast models (e.g., US GFS, European Center and UK Met Office models), and  then do sophisticated sophisticated statistical postprocessing to combine the forecasts in an optimal way.   The National Weather Service has lagged in statistical postprocessing, depending heavily on a forty-year old system called MOS, Model Output Statistics.    Thus, it the guidance provided to National Weather Service forecasts has been less than state of the art.

Fortunately, this is changing.   During the past year, the NWS has developed the National Blend of Global Models, which statistically combines an international collection of global models and traditional MOS to produce better forecasts.   The results so far are encouraging, with reduced error and lower biases.

With these advances, I would expect the National Weather Service average statistics will move closer to the Weather.coms and Accuweathers during the next year.

The National Weather Service human forecasters do play an important forecasting role, particularly when unusual and extreme weather occurs.  Events in which the models and statistics can fail, but where long experience and physical insights can be critical.  Some private firms, like Accuweather, have also invested heavily in a substantial human forecaster contingent.

The National Weather Service forecasters are positioned in a two-tiered system:  the roughly 120 forecasts offices spread around the nation, and national speciality centers, such as the the Storm Prediction Center in Norman Oklahoma or the Weather Prediction Center in Washington DC.  The first group is responsible for local prediction, while the latter specializes in specific types of extreme events, like severe convection (Storm Prediction Center) and heavy precipitation/flooding (Weather Prediction Center).

The Weather Prediction Center has found that humans can provide positive impacts for very heavy precipitation events over numerical model guidance (of course the humans START with the numerical guidance).  The Storm Prediction Center is absolutely world class, providing the best severe thunderstorm warnings in the world.

The future will be one where garden variety weather is mainly taken care of by statistically corrected ensembles of models, with humans spending most of their time dealing with extreme weather, resolving with model problems, and communicating forecasts to the public and critical user communities.  

Even  today if you are looking for a weather forecast on average day, the forecast from your typical weather app (weather.com, accuweather, etc.) are fine.  But when severe weather is possible, turning to an outlet in which humans are carefully following the situation is advised.

Sunday, June 26, 2016

Freezing Temperatures in Star Valley

It was another cold early summer morning in Western Wyoming. The lowest temperature in Star Valley was observed at Double L dipping to 29F.  Over in Bondurant it dipped to a frigid(for June) of 21F. Warmer days are ahead this week.

Minimum temperatures Sunday June 26 2016

Saturday, June 25, 2016

Summer Frost/Freeze in Western Wyoming

In the wake of a cold front on Friday, temperatures dropped to near or a little below  freezing in much of Western Wyoming by sunrise Saturday. The coldest reported in Star Valley was 30F at Afton airport, followed by 32F at Thayne Elementary and Double L Ranch. The air mass is quite dry so only a light frost was likely experienced. Below is a plot of observed minimums this mornng.

Minimum temperatures Saturday June 25 2016


Friday, June 24, 2016

Red Flag Warning Western Wyoming

...HOT...DRY...WINDY...AND UNSTABLE WEATHER TO CONTINUE TO FOR
PORTIONS OF SOUTHWEST AND CENTRAL WYOMING THIS
AFTERNOON...CONTINUING THROUGH SATURDAY EVENING FOR CENTRAL
WYOMING...

.STRONG UPPER LEVEL RIDGING AND INCREASING WEST TO SOUTHWEST
SURFACE WINDS WILL ALLOW FOR HOT TEMPERATURES AND MOSTLY DRY
CONDITIONS TO CONTINUE OVER PORTIONS OF SOUTHEAST AND CENTRAL
WYOMING WHERE FUELS ARE CRITICAL. SOME DRY THUNDERSTORM CHANCES
WILL ALSO CONTINUE TODAY OVER PORTIONS OF NATRONA COUNTY. EXTREME
CONDITIONS WILL CONTINUE THROUGH THE EARLY EVENING ON
SATURDAY...BEFORE DECREASING FIRE DANGER ON SUNDAY BEHIND A COOL
FRONT.


SALT AND WYOMING RANGES/WEST ZONE BRIDGER TETON NF-
WEST WIND RIVER MOUNTAINS/EAST ZONE BRIDGER TETON NF-
1202 AM MDT FRI JUN 24 2016

...RED FLAG WARNING IN EFFECT FROM NOON TO 9 PM MDT TODAY FOR A
STRONG FRONTAL PASSAGE...LOW RH VALUES...AND WIND GUSTS NEAR OR IN
EXCESS OF 25 MPH FOR FIRE WEATHER ZONES 414 AND 416...

THE NATIONAL WEATHER SERVICE IN RIVERTON HAS ISSUED A RED FLAG
WARNING...WHICH IS IN EFFECT FROM NOON TO 9 PM MDT FRIDAY.

* WIND...15 TO 25 MPH WITH GUSTS 30 TO 45 MPH.

* HUMIDITY...12 TO 18 PERCENT.

* IMPACTS...ANY FIRES THAT DEVELOP WILL LIKELY SPREAD RAPIDLY.
  OUTDOOR BURNING IS NOT RECOMMENDED.

PRECAUTIONARY/PREPAREDNESS ACTIONS...

PRECAUTIONARY/PREPAREDNESS ACTIONS...

A RED FLAG WARNING MEANS THAT CRITICAL FIRE WEATHER CONDITIONS
ARE EITHER OCCURRING NOW....OR WILL SHORTLY. A COMBINATION OF
STRONG WINDS...LOW RELATIVE HUMIDITY...AND WARM TEMPERATURES CAN
CONTRIBUTE TO EXTREME FIRE BEHAVIOR.

Thursday, June 23, 2016

Deadly Tornado in China

While much of the tornado attention typically focuses on the United States, other areas of the world can be  affected as well. Such was the case in the city of Yancheng China on June 23rd.


Following is a blog about the China tornado by Bob Henson


At Least 78 Deaths in China Tornado

By: Bob Henson , 4:29 PM GMT on June 23, 2016
   
A tornado struck the outskirts of the east-central Chinese city of Yancheng during a powerful thunderstorm on Thursday afternoon, killing at least 78 people and causing widespread destruction. Yancheng is an urban area of more than 8 million people with a city-center population of about 1.6 million, located in the coastal plain of China’s Jiangsu Province about 200 miles north of Shanghai. Chinese state media are reporting nearly 500 injuries, with 200 critical. The storm also produced hail and heavy rain. 


Figure 1. Residents pass houses destroyed in the aftermath of a tornado that hit Funing county, in Yancheng city in eastern China's Jiangsu Province on Thursday, June 23, 2016. A powerful tornado killed dozens and destroyed large numbers of buildings Thursday in the eastern Chinese province of Jiangsu, state media reported. Image credit: Color China Photo via AP.


Figure 2. A villager stands near houses destroyed in the aftermath of a tornado that hit Funing county in Yancheng city in eastern China's Jiangsu Province on Thursday, June 23, 2016. Image credit: Color China Photo via AP.


Figure 3. Himiwari-8 satellite image from 0600Z on June 23, 2016 (2:00 am Thursday EDT, or 2:00 pm Thursday local time in Yancheng, China). A band of intense thunderstorms stretched more than 600 miles across central and northeastern China. The apparent tornado struck the Yancheng area around 2:30 pm local time Thursday. The coldest cloud tops associated with the Yancheng thunderstorm (blue and green colors] span about 250 to 300 miles (400-480 km]. Image credit: CSU/CIRA/RAMMB, courtesy Japanese Meteorological Agency.

Another deadly result of the Mei-yu front
Intense storms are common along the Mei-yu (or baiu) front, which typically persists for a few weeks in late spring and early summer. This semi-permanent feature extends from eastern China across Taiwan into the Pacific south of Japan, associated with the southwest monsoon that pushes northward each spring and summer. The AMS Glossary notes: “The mei-yu/baiu front is very significant in the weather and climate of southeast Asia as it serves as the focus for persistent heavy convective rainfall associated with mesoscale convective complexes (MCCs) or mesoscale convective systems (MCSs) that propagate eastward.” A number of studies have found that the Mei-yu rainfall tends to be particularly heavy in the summer following an El NiƱo event.

On June 1, 2015, China experienced its worst peacetime maritime disaster on record, as 442 people died when acruise ship capsized on the Yangtze River during an intense Mei-yu thunderstorm. Although a tornado struck about five miles away, an official report found that a strong microburst was most likely responsible for the capsizing. Similarly, it may take time to determine how much of the damage in Yancheng was related to tornadic activity as opposed to any downbursts that may have occurred. As shown in the map below, eastern China is one of the more tornado-prone parts of Eurasia.


Figure 4. The relative likelihood that the atmosphere would support tornado production within grid boxes of 2° latitude and longitude, as estimated from model-generated atmospheric profiles. The scale is logarithmic; a value of -2.0 (orange) corresponds to 15 six-hour periods per year that are tornado-favorable, and the likelihood increases or decreases by a factor of 10 for every change of 1.0 on the axis at bottom. Image credit: Courtesy Harold Brooks, NOAA National Severe Storms Laboratory. An earlier version of this graphic appears in Brooks et al., “The spatial distribution of severe thunderstorm and tornado environments from global reanalysis data,” Atmospheric Research 67-68 (2003

Monday, June 20, 2016

First Official Day of summer produces Record Temperatures over the Desert Southwest

Summer time temperatures ushered in the official start of summer
across Star Valley. Following are the observed maximums across 
the valley on Monday

Maximum temperatures June 20 2016
The morning lows were very cool producing dramatic ranges in the daily temperatures
Minimum temperatures June 20 2016


An example of the range of temperatures from dawn to mid afternoon is illustrated
by the graph of the Thayne ES temperatures for the 3 days ending June 20th.


However it was blistering hot to our south over the desert southwest.  Following are some of the 
records reported from the weather offices.


NATIONAL WEATHER SERVICE LAS VEGAS, NV
 547 PM PDT MON JUN 20 2016
 
 ...NUMEROUS RECORD HIGH TEMPERATURES SET TODAY...
 
 RECORD DAILY HIGHS
 
 LAS VEGAS, NV 115 DEGREES (OLD 113 SET IN 2015) 
 NEEDLES, CA 125 DEGREES (OLD 118 SET IN 1961) 
 DEATH VALLEY, CA 126 (OLD 125 SET IN 1961) 
 KINGMAN, AZ 111 DEGREES (OLD 108 IN 1936) 
 DESERT ROCK, NV 109 DEGREES (TIES 2015)
 
 THE 125 DEGREES IN NEEDLES, CA SETS A NEW MONTHLY RECORD FOR JUNE.
 THE PREVIOUS RECORD WAS 123 DEGREES SET ON JUNE 29TH 2013. IT ALSO
 TIES THE ALL-TIME HIGH OF 125 DEGRESS SET IN 1925 AND IN 2005.  
 
 THIS MORNINGS LOW OF 86 DEGREES IN LAS VEGAS BROKE THE RECORD FOR 
 WARMEST LOW TEMPERATURE FOR THIS DATE. PREVIOUSLY THE RECORD WAS 
 84 DEGREES SET IN 1996. 


NATIONAL WEATHER SERVICE SAN DIEGO CA
 431 PM PDT MON JUN 20 2016 
 
 ...HIGHEST MAXIMUM TEMPERATURE RECORDS BROKEN OR TIED ON JUN 20 2016 ...
 
 LOCATION             NEW RECORD         OLD RECORD        PERIOD OF RECORD
 
 RAMONA                   109            106 IN 2008             1974
 RIVERSIDE                114            110 IN 2008             1893
 PALM SPRINGS             122            118 IN 1929             1893
 THERMAL                  121            118 IN 2008             1950
 CHULA VISTA               91             85 IN 2008             1918
 ESCONDIDO                106            104 IN 1973             1893
 ALPINE                   107    TIED    107 IN 1973             1951
 EL CAJON                 107             94 IN 2007             1979
 IDYLLWILD                 97             95 IN 2001             1943
 PALOMAR MOUNTAIN          96             92 IN 2015             1901
 CAMPO                    110            105 IN 2008             1948
 INDIO                    120            116 IN 1929             1894
 BORREGO                  118*           116 IN 2008             1942

NATIONAL WEATHER SERVICE PHOENIX AZ
 0512 PM MST MON JUN 20 2016
 
 ...RECORD HIGH TEMPERATURE SET AT PHOENIX AZ...
 
  A RECORD HIGH TEMPERATURE OF 116 DEGREES WAS SET AT PHOENIX AZ TODAY. 
 THIS BREAKS THE OLD RECORD OF 115 SET IN 1968.
 

Wednesday, June 15, 2016

Update on Expected Heat Wave this Weekend

Jim Steenburgh of the UofU providing a look at the Heat Wave coming this weekend over the desert Southwest. Here in Star Valley it will be warm(not hot) and dry. Enjoy!


Southwest Bakefest on Tap

Over the next several days, portions of the southwest U.S. will experience a warming trend leading to fry-an-egg-on-the-sidewalk conditions as a high amplitude ridge sets up over the region.  The 500-mb heights look to be about as high as they get, exceeding 6000 meters (6 km) near the center of the ridge.  For example, in the GFS forecast for 0000 UTC 20 June (6 PM MDT Sunday), 500-mb heights exceed 6000 meters at a few locations in Arizona, New Mexico, and Colorado.  Temperatures at 925-mb, roughly 750 meters above sea level, exceed 40ĀŗC (104ĀŗF) across most of Arizona (Note: this level is below ground for high-elevation regions, but illustrates the extreme heat for lower elevation portions of the state).

0600 UTC 15 June GFS 500-mb height and 925-mb temperature forecast valid 0000 UTC 20 June
The National Weather Service has issued an excessive heat watch for much of southern California and Arizona.
Source: NWS
Excessive heat in that part of the world means an event fit for neither man nor snake.  I pulled up the National Weather Service grid-point forecast for the Phoenix airport and forecast maximum temperatures climb from 103ĀŗF today to 119ĀŗF on Sunday.  In the extended (not shown), forecast highs are 119ĀŖF on Monday and 117ĀŗF on Tuesday.  The all-time record high in Phoenix is 122ĀŗF, set on June 26th, 1990.  

Source: Phoenix
This is still a relatively long lead time forecast, so there's some uncertainty in just how high it will go, but an oppressively hot situation looks quite likely.  Right now, northern Utah looks to be on the periphery of the worst temperatures, meaning temperatures above average this weekend (high 80s at the Salt Lake airport), but not at record levels.  After that, we'll have to see.  

Monday, June 13, 2016

Heads Up on Heat Wave Expected in Arizona by the Weekend

While here in Star Valley we will be experiencing typical beautiful
Star Valley summer weather, this will not be the case for our neighbors
to the south. Following is an early alert to a possible record setting 
heat wave in the desert southwest by this coming Weekend.


NORTHWEST MARICOPA COUNTY-GREATER PHOENIX AREA-
SOUTHWEST MARICOPA COUNTY-
NORTHWEST AND NORTH CENTRAL PINAL COUNTY-
INCLUDING THE CITIES OF...BUCKEYE...LAKE PLEASANT...MORRISTOWN...
NEW RIVER...TONOPAH...WICKENBURG...CAREFREE...CAVE CREEK...
CHANDLER...FOUNTAIN HILLS...GILBERT...GLENDALE...MESA...PEORIA...
PHOENIX...SCOTTSDALE...SUN CITY...TEMPE...GILA BEND...
APACHE JUNCTION...CASA GRANDE...COOLIDGE...FLORENCE
344 AM MST MON JUN 13 2016

...EXCESSIVE HEAT WATCH REMAINS IN EFFECT FROM FRIDAY MORNING
THROUGH MONDAY EVENING...

* AFFECTED AREA...THE LOWER DESERTS OF SOUTH-CENTRAL ARIZONA
  INCLUDING THE GREATER PHOENIX AREA.

* TEMPERATURE...HIGHS FRIDAY OF 105-110 DEGREES. HIGHS SATURDAY OF 110-115
  DEGREES. HIGHS SUNDAY THROUGH MONDAY OF 115-120 DEGREES WITH PEAK
  HEAT ON SUNDAY.

* IMPACTS...HEAT RELATED ILLNESS WILL BE LIKELY FOR THOSE DOING
  STRENUOUS ACTIVITY OUTDOORS...OR THOSE WITH HEALTH CONDITIONS
  THAT DO NOT HAVE ADEQUATE ACCESS TO AIR CONDITIONING. IF
  UNTREATED...SOME ILLNESS EVENTS COULD BE FATAL.

PRECAUTIONARY/PREPAREDNESS ACTIONS...

NEVER LEAVE KIDS OR PETS UNATTENDED IN CARS. DRINK MORE WATER
THAN USUAL AND AVOID ALCOHOL...SUGAR...AND CAFFEINE. WHEN
OUTDOORS...WEAR LIGHT COLORED CLOTHING AND A WIDE-BRIMMED HAT TO
KEEP YOUR HEAD AND BODY COOLER. TAKE FREQUENT REST BREAKS IN
SHADED OR AIR CONDITIONED ENVIRONMENTS. PUBLIC PLACES WITH AIR
CONDITIONING INCLUDE LIBRARIES...COMMUNITY CENTERS...GOVERNMENT
BUILDINGS...MALLS...AND SPECIAL REFUGE STATIONS.

RECOGNIZE THE SIGNS AND SYMPTOMS OF HEAT ILLNESS. EARLY SYMPTOMS
INCLUDE THINGS SUCH AS HEADACHE...THIRST...AND MUSCLE CRAMPS.
SERIOUS SYMPTOMS INCLUDE WEAKNESS...SKIN THAT IS COOL TO THE
TOUCH...FAST BUT WEAK PULSE...NAUSEA...AND FAINTING. SEVERE
SYMPTOMS INCLUDE HOT AND RED DRY SKIN...FAST AND STRONG PULSE...
SWEATING THAT HAS STOPPED...AND UNCONSCIOUSNESS. UNTREATED HEAT
ILLNESS CAN LEAD TO FATAL HEAT STROKE.

STAY COOL...STAY HYDRATED...STAY INFORMED.
Forecast 500mb  Chart for 6pm Sunday June 19 2016
Forecast Surface temperatures for 6 pm Sunday June 19 2016


Friday, June 10, 2016

Final 2016 Water Supply Outlook for Wyoming

The final  report for the Wyoming Water Supply Outlook for 2016 from the Riverton NWS Office is very optimistic with much of the state expecting to be near or above normal gong into the  summer months. 


Synopsis:
May precipitation totals across Wyoming were 115 to 125 percent of average. Precipitation numbers varied between 225 percent of normal over the Lower Green River Basin (southwestern Wyoming) to near 55percent of normal over the Belle Fourche River Basin (northeastern Wyoming).  Current water year (October 2015 – May 2016) precipitation across Wyoming remained near 120 percent of average.
Mountain snowpack across Wyoming increased to 105 to 115 percent of median by early June.  Snowpack "water" numbers and/or SWEs were the highest across basins in central through southern Wyoming—varying between 130 to 150 percent of median.  SWEs across the Snake and Upper Yellowstone  Watersheds varied between 65 to 75 percent of median.
Near normal (95 to 100 percent) snowmelt streamflow volumes are expected across the state as a whole.  Above normal streamflow volumes are expected across a majority of the Wind River, the Big Horn, the Upper North Platte, and the Laramie Watersheds.  The Upper Yellowstone, Snake, Powder, and Tongue River Basins are forecasted to have below normal streamflow volumes during the rest of the snowmelt season.
Reservoirs storages across Wyoming increased to 120 to 130 percent for early June. 

Friday, June 3, 2016

40th Anniversary of Teton Dam Failure-June 5 1976

Teton Dam Failure

From Wikipedia, the free encyclopedia
Teton Dam
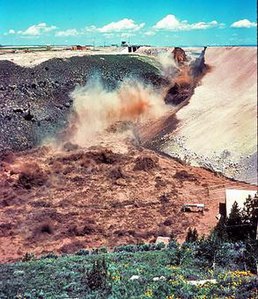
(IDAHO-L-0010) Teton Dam Flood - Newdale.jpg
Catastrophic failure on June 5, 1976
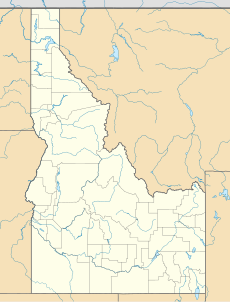
Teton Dam is located in Idaho
Teton Dam
Location in eastern Idaho
Official nameTeton Dam
CountryUnited States
LocationFremont & Madison counties, Idaho
Coordinates43°54′35″N 111°32′21″WCoordinates43°54′35″N 111°32′21″W
PurposeFlood control, irrigation
Construction began1972[1]
Opening date1976
Demolition dateJune 5, 1976 (failure)
Construction cost$48,825,000
Owner(s)U.S. Bureau of Reclamation
Dam and spillways
Type of damEmbankment dam
ImpoundsTeton River
Height305 ft (93 m)
Length3,100 ft (940 m)
Width (base)1,700 ft (520 m)
Reservoir
CreatesTeton Reservoir
Total capacity288,250 acre feet (355,550,000 m3)[2]
Normal elevation5,320 ft (1,620 m) AMSL[2]
The Teton Dam was an earthen dam on the Teton River in Idaho, United States. It was built by the Bureau of Reclamation, one of eight federal agencies authorized to construct dams.[3] Located in the eastern part of the state, between Fremont and Madison counties, it suffered a catastrophic failure on June 5, 1976, as it was filling for the first time.
The collapse of the dam resulted in the deaths of 11 people[4] and 13,000 cattle. The dam cost about $100 million to build, and the federal government paid over $300 million in claims related to its failure. Total damage estimates have ranged up to $2 billion.[5] The dam has not been rebuilt.

History and geology[edit]

There had been interest in building a dam in the eastern Snake River Plain for many years to control spring runoff and provide a more constant water supply in the summer. The area had suffered a severe drought in 1961, followed by serious flooding in 1962. The Bureau of Reclamation (USBR) proposed the Teton Dam in 1963, and Congress passed without opposition an authorizing bill the following year. The planned dam was to be an earthen structure 310 feet (94 m) high and 0.6 miles (1.0 km) long and create a reservoir 17 miles (27 km) in length. The impounded water would be used to generate hydroelectric power. An environmental impact statement was issued for the dam in 1971, but it did not raise the possibility of a collapse.[3]
The primary contractor for the dam was Morrison-Knudsen Co. of Boise, assisted by Peter Kiewit Sons Co. of Omaha, Nebraska. The $39 million contract was awarded in December 1971 and work began in 1972.[1]
The eastern Snake River Plain is almost entirely underlain by basalt erupted from large shield volcanos on top ofrhyolitic ash-flow tuff and ignimbrites.[6] The tuff, a late-Cenozoic volcanic rock is 1.9 million years old. The dam site is composed of basalt and rhyolite, both of which are considered unsuitable for dam construction because of their highpermeability. This was confirmed by long term pump-in tests at rates of 165 to 460 US gallons (620 to 1,740 litres) per minute.[7] Test cores, drilled by engineers and geologists employed by the Bureau of Reclamation, showed that the rock at the dam site is highly fissured and unstable, particularly on the right side of the canyon. The widest fissures were determined to be 1.7 inches (4.3 cm) wide. The Bureau planned to seal these fissures by injecting grout into the rock under high pressure to create a grout curtain in the rock.
In addition, an investigation of the area by geologist of the U.S. Geologic Survey indicated that it was seismically active: five earthquakes had occurred within 30 miles (50 km) of the dam site in the previous five years, two of which had been of significant magnitude. This information was provided to the Bureau of Reclamation in a memorandum, but the geologists' concerns were considerably watered down in the six-month re-drafting process before the USGS sent the final version of the memo to the USBR in July 1973.[3]
In 1973, when the dam was only half-built, but almost $5 million had already been spent on the project, large open fissures were encountered during excavation of the key trench near the right end of the dam, about 700 feet (210 m) from the canyon wall. The two largest, near-vertical fissures trend generally east-west and extend more than 100 feet (30 m) below the bottom of the key trench. Some of the fissures are lined by calcite, and rubble fills others. Several voids, as much as 6 inches (15 cm) wide, were encountered 60 to 85 feet (18 to 26 m) below the ground surface beyond the right end of the dam and grout curtain.[7] The largest fissures were actually enterable caves. One of them was eleven feet (3.4 m) wide and a hundred feet (30 m) long. Another one was nine feet (2.7 m) wide in places and 190 feet (60 m) long. These were not grouted because they were beyond the keyway trench and beyond the area where the Bureau had decided grouting was required.[8] This necessitated using twice as much grouting as had been originally anticipated – 118,000 linear feet were used in total. Later, the report of a committee of the House of Representatives which investigated the dam's collapse felt that the discovery of the caves should have been sufficient for the Bureau of Reclamation to doubt its ability to fill them in with grout, but this did not happen: the Bureau continued to insist, even after the dam had failed, that the grouting was appropriate.[3]

Filling[edit]

The dam was completed in November 1975, and filling the reservoir began at the standard rate of 1 foot (0.30 m) a day. However, snows were heavy that winter, and five months later the project's construction engineer requested permission to double the filling rate in order to deal with the additional spring run-off, while continuing to inspect for leaks and monitor the groundwater. A month later, even though monitoring showed that groundwater was flowing a thousand times faster than had been originally anticipated, the filling rate was doubled again, to 4 feet (1.2 m) a day.[3]
On June 3 and 4, 1976 three small springs were discovered downstream of the dam, although the water running through the leaks was clear, and such leaks are not unexpected for an earthen dam. At the time, the reservoir was almost at capacity, with a maximum depth of 240 feet (73 m). The only structure that had been initially prepared for releasing water was the emergency outlet works, which could carry just 850 cubic feet per second (24 m3/s). The main outlet works and spillway gates were not yet in service: the gates were cordoned off by steel walls while they were being painted.

Collapse and flood[edit]

On Saturday, June 5, 1976, at 7:30 a.m. Mountain Daylight Time (MDT), a muddy leak appeared, suggesting sediment was in the water, but engineers did not believe there was a problem. By 9:30 a.m. the downstream face of the dam had developed a wet spot which began to discharge water at 20 to 30 cubic feet per second (0.57 to 0.85 m3/s) and the embankment material began to wash out. Crews with bulldozers were sent to plug the leak, but were unsuccessful. Local media appeared at the site, and at 11:15 officials told the county sheriff's office to evacuate downstream residents. Work crews were forced to flee on foot as the widening gap, now larger than a swimming pool, swallowed their equipment. The operators of two bulldozers caught in the eroding embankment were pulled to safety with ropes.
At 11:55 a.m. MDT (UTC-17:55), the crest of the dam sagged and collapsed into the reservoir; two minutes later the remainder of the right-bank third of the main dam wall disintegrated. Over 2,000,000 cubic feet per second (57,000 m3/s) of sediment-filled water emptied through the breach into the remaining 6 miles (10 km) of the Teton River canyon, after which the flood spread out and shallowed on the Snake River Plain. By 8:00 p.m. that evening, the reservoir had completely emptied, although over two-thirds of the dam wall remained standing.

Cause[edit]

Study of the dam's environment and structure[9] placed blame for the collapse on the permeable loess soil used in the core and on fissured (cracked) rhyolite in the abutments of the dam that allowed water to seep around and through the earth fill dam. The permeable loess was found to be cracked. It is postulated that the combination of these flaws allowed water to seep through the dam and led to internal erosion, called piping, that eventually caused the dam's collapse.
An investigating panel had quickly identified piping as the most probable cause of the failure, then focused its efforts on determining how the piping started. Two mechanisms were possible. The first was the flow of water under highly erodible and unprotected fill, through joints in unsealed rock beneath the grout cap, and development of an erosion tunnel. The second was "cracking caused by differential strains or hydraulic fracturing of the core material." The panel was unable to determine whether one or the other mechanism occurred, or a combination:
The fundamental cause of failure may be regarded as a combination of geological factors and design decisions that, taken together, permitted the failure to develop.
A wide-ranging controversy ensued from the dam's collapse. According to the Bureau of Reclamation, BOR engineers assess all Reclamation dams under strict criteria established by the Safety of Dams program. Each structure is periodically reviewed for resistance to seismic stability, internal faults and physical deterioration.[4] The dam safety program identified two other dangerous dams - Fontenelle, which very nearly failed like the Teton Dam when it was filled and again in May 1985 and the Jackson Lake Dam which would have failed during an earthquake on the nearby Teton Fault.

Deaths, damage and property claims[edit]


Teton Dam ruins in 2004
Teton Canyon ends approximately six miles below the dam site, where the river flows onto the Snake River Plain. When the dam failed, the flood struck several communities immediately downstream, particularly Wilford at the terminus of the canyon, Sugar City, Salem, Hibbard and Rexburg. Thousands of homes and businesses were destroyed. The small agricultural communities of Wilford and Sugar City were wiped from the river bank. Five of the fourteen deaths attributed to the flood occurred in Wilford. The similar community of Teton City, on the south bank of the river, is on a modest bench and was largely spared.[10] One Teton resident was fishing on the river at the time of the dam failure and was drowned. An elderly woman living in Teton City died as a result of the evacuation.[11]
One estimate placed damage to Hibbard and Rexburg area, with a population of about 10,000, at 80 percent of existing structures. The Teton River flows through the industrial, commercial and residential districts of north Rexburg. A significant reason for the massive damage in the community was the location of a lumber yard directly upstream. When the flood waters hit, thousands of logs were washed into town. Dozens of them hit a bulk gasoline storage tank a few hundred yards away. The gasoline ignited and sent flaming slicks adrift on the racing water.[12] The force of the logs and cut lumber, and the subsequent fires, practically destroyed the city.
The flood waters traveled west along the route of the Henry's fork of the Snake River, around both sides of the Menan Buttes, significantly damaging the community of Roberts. The city of Idaho Falls, even further down on the flood plain, had time to prepare. At the older American Falls Damdownstream, engineers increased discharge by less than 5% before the flood arrived.[13] That dam held, and the flood was effectively over, but tens of thousands of acres of land near the river were stripped of fertile topsoil.[5]
The force of the failure destroyed the lower part of the Teton River, washing away riparian zones and reducing the canyon walls. This seriously damaged the stream's ecology and impacted the native Yellowstone cutthroat trout population. The force of the water and excessive sediment also damaged stream habitat in the Snake River and some tributaries, as far downstream as the Fort Hall bottoms.
After the dam's collapse, debris clean-up began immediately and took the remainder of the summer. Rebuilding of damaged property continued for several years. Within a week after the disaster, President Gerald Ford requested a $200 million appropriation for initial payments for damages, without assigning responsibility for Teton Dam’s failure.[14]
The Bureau of Reclamation set up claims offices in Rexburg, Idaho Falls, and Blackfoot. By January 4, 1977, disaster victims filed over 4,800 claims totalling $194 million. By that date, the federal government paid 3,813 of those claims, $93.5 million. Originally scheduled to end in July 1978, the claims program continued into the 1980s. At the end of the claims program in January 1987, the federal government had paid 7,563 claims for a total amount of $322 million.
.